Surprisingly (to me) I haven’t talked about the Daily Desmos project on this internetsblog. Daily Desmos is a project that I’ve been involved with since March. It has daily graphing challenges that you can use the desmos graphing utility to solve.
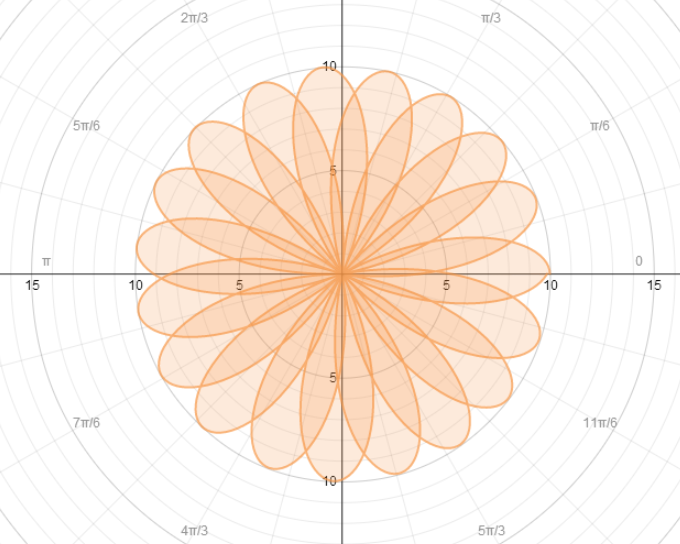
For instance: What (polar) inequality created this graph?

(Created by the wonderful Sam Shah. If you can solve this unsolved puzzle then leave a comment here.)
Call for Action
We would love to have some new contributors to the Daily Desmos project.
Do you enjoy creating interesting graphs?
Do you want to help out a project that is trying to refocus on being more useful in classrooms?
Do you want to be included in the ranks of the illustrious DD crew (Sadie Estrella, Kate Nowak, Jessica Algebrainiac, Michael Fenton, Me, Justin Lanier, Sam Shah, or our first retiree Michael Pershan)?
Responsibilities:
- Create a basic and advanced graph once every two or three weeks.
- Post the graphs on the blog.
- ????
- Profit!
To limit the anxiety that is natural with extra responsibilities during the school year, we’ve decided to create a 4 month term. If at the end of this term you feel you’d like to sign up again then you are free to do so. You may also appoint a successor to your position. Or leave the seat open to an open call. Up to you.
Sounds Great! How do I throw my hat in the ring?
Great question. Tweet (or email) me, Justin Lanier, or Michael Fenton. Thanks for your consideration!

Pingback: Daily Desmos: Phase Two and You | I Choose Math
Pingback: Daily Desmos » DAILY DESMOS 2.0 Released! (and Daily Desmos 137a (Advanced))
Pingback: Math 753 • Session 3 | Reason and Wonder