My Favorite for the Students

Let me know if these are things that interest you as a teacher of children:

  • You want the students to find your subject interesting.
  • You want the students to investigate your subject in their own time, like an adult would do.
  • You want the students to continue to develop their presentation skills.
  • You want the students to pique the interest of the other students in the class in your subject.
  • You want to expose the students in your class to a diverse set of ideas, opinions, and experiences.

When I (briefly) attended Twitter Math Camp last year, I really enjoyed the My Favorite section of the conference. This is a section where teachers came forward and presented something that they liked that they thought the other teachers would be interested in. These included activities, strategies, etc. Pretty much whatever the presenter thought the other teachers would enjoy. They had about 5-10 minutes to present.

To co-opt this My Favorite structure to my classroom, I asked every student in all of my classes to present one thing that they found interesting about math.

Here’s the document that I gave the students:
My_Favorite

How’d it go?

Great! I loved it, and I (think) the kids loved it. We had so many different and interesting topics. Here’s a quick subset of the topics that were covered in three of the classes:

Fibonacci and Bartok
Piles
Friendship Paradox
Volleyball winning odds
Pi Cupcakes
Vortex Math
Birthday Paradox
Chaos Theory
Hairy Ball Theorem
3D Polyhedra
Pythagorean Thm
Riot Theory
Monty Hall Paradox
Pappus of Alexandria Thm
Cryptarithms
Golf Handicap
Quad Midpoints make Parallelogram
Kaprekar’s Constant
Number Trick
4 color theorem
Diving Scoring
Brouwers fixed point theorem
P vs NP
Mole Train Woot Woot
Sound and Sine
Fourier Transforms
Photography
4D
Golden Ratio
Font Layout and Yearbook
Binary Numbers
Fermat’s Last Theorem
Rule of 72
Symmetry
Mobius Strip
Paradoxes
Nines
P vs NP
Euler
Golden Ratio and Phi
Mandelbrot Fractal
Reuleaux Polygons
Graham’s Number
Pascal’s Triangle
Tesselations
Schwarz lantern
Monty Hall
Math (and Physics) of Bowling
What’s faster, going up or going down?

Only recognize about 2/3rds of them? Me too. It was awesome seeing the different mathematics that was discussed in our classes. What was the percent of topics that lined up with any of the final exams? I’d say under 5%.

Do you have 2-5 min to spare 30 or so times per class per year with very little burden of prep on the teacher? I would bet that you do.

Posted in Full Posts | Tagged | 10 Comments

Lizard Grow

My son was given this lizard as a big brother gift (can’t find online link to product, but here’s a similar toy).
SONY DSC
Thoughts?

Original Size

SONY DSC

Size After 2 Day Soak

SONY DSC

Before Measurements

Left image
Length: 905 pixels
Width (between front feet): 275 pixels
1 inch: 90 pixels
Right image
Height: 150 pixels
1 inch: 115 pixels

After Measurements

Left image
Length: 1014 pixels
Width (between front feet): 292 pixels
1 inch: 60 pixels
Right image
Height: 200 pixels
1 inch: 98 pixels

Calculations

Original Length: 10.06″
Original Width: 3.06″
Original Height: 1.30″

After Length: 16.90″ (increase of 68%)
After Width: 4.87″ (increase of 59%)
After Height: 2.04″ (increase of 57%)

Conclusion

Liars!

Calculations Take 2

Volume of box that would just contain original lizard: 10.06 * 3.06 * 1.30 = 40.02 cubic inches
Volume of box that would just contain soaked lizard: 16.90 * 4.87 * 2.04 = 167.90 cubic inches (increase of 319%)

Conclusion Take 2

Liars!
Thoughts? Did I mess up?

More Questions

  • How big would it be if the volume *did* increase by 600%?
  • How big would the lizard be if it grew 1000%? 10,000%?
  • How big would the lizard have grown if it just barely fit in *your* classroom?
Posted in Full Posts | Tagged , , , | 3 Comments

M&M’s Mega

mms
2014-05-30_12h04_10

3x the Chocolate?

What a great Calculus activity (hint: rotational volumes).
Cross sections with an exacto:

M&M

mmcrosssection

M&M Mega

megammcrosssection

What shape fits best? Click on image to get directly to the desmos interactive.
2014-05-30_11h33_58
Pretty good fit.
Here’s the data for each type. I used a caliper to measure the dimensions.
2014-05-30_11h36_32

To account for the candy shell you can measure pixels in an image manipulation program. If you’d like to follow along at home, the M&M Mega has a thickness of 404 pixels, and the chocolate only (no shell) has a thickness of 333 pixels. The regular M&M has a thickness of 251 pixels, and a chocolate thickness of 210 pixels.

You have enough information to do some damage, go ahead and see if the M&M’s Mega truly have 3x the chocolate of the regular M&M’s.

Results

M&M Mega volume of 1,423 mm^3.
megammwork
Regular M&M volume of 474.8 mm^3.
mmwork

Fun. Great activity for calculus.
Phew, no fox news.

Posted in Full Posts | Tagged , , | 3 Comments

Daily Desmos 3.0

Hello all, we’re looking to reinvigorate the Daily Desmos project and we’re looking for new contributors (and that means you!). We’re taking away the schedule and the numbering system so you can submit posts directly to DD whenever you’d like. You can still submit images via email, but we’re going to increase the number of authors on the website and we’d like your help! Would you like to sign up? The only responsibility that you have is to post a Desmos image whenever you’d like. Yep that’s it! Interested? Comment on this post, contact me on twitter, or email me at my email address. Thanks!

Posted in interesting stuff | Tagged , | 1 Comment

Feedback On My Feedback System


In response to the Dark Lord Pershauron, I’ve decided to see what feedback you all have for my current SBG setup (v 5.0).
The course is Pre-Calculus honors. There are about 40ish standards for the year. About once a week students take a test on several standards (2-4). The first time they see the standard there is no grade; this is an opportunity for the students to see where they are. I started off giving them feedback but moved to self-feedback only: when finished, they go to a feedback station (@fnoschese style), grab a colored pen, look at the key and give themselves feedback. Sometimes they work in their groups to get the feedback and I put the key up on edmodo (all the keys end up on edmodo). They keep these feedback quizzes and put them in their folder.

The second time they see a standard it is for a grade, normally a week or two after we’ve taught the topic in class (grade out of 5: 5, 4.5, 4, 3, or 2). The grade goes in the books as is. They get three reassessment opportunities per term (out of 10-15 total standards per term). They see their graded quiz, but they don’t get to keep the graded assessment.
Things I need to get better at for next year:
Providing feedback myself to the student instead of just leaving it up to them. I like they they take responsibility in knowing what they know and don’t know, but I don’t think they are always able to give themselves the directed feedback that a teacher could give. I get a general idea of where the class is by informally going around and looking at order prednisone Canada quizzes post feedback, but I don’t have the whole picture. This informal feedback has changed the class, sometimes its obvious that they’ve understood a topic and we can move on, other times it’s clear that we need to take a different look at this material before moving on.

Thoughts? Comments? Let me have it. I see this as shot peening for my grading system. Thanks in advance!

Posted in Full Posts | Tagged | 5 Comments

Money Duck

This is a crosspost from my 180 photo blog.

Introduction

If you haven’t read Dan Meyer’s take on the Money Duck, go ahead and read up.

Here’s some classroom action:
20140508-140619.jpg
20140508-140626.jpg

Act 1

I presented the Money Duck to my PreCalculus H classes. We were in the midst of probability and we were moving towards probability distributions and expected value. This activity popped up at just the right time to (quickly) try it out. So without any lead in to the activity, I showed the picture of the money duck:
140426_1
Then showed the video that Dan made:

After the video I overheard quotes like

Student Alpha: That’s really annoying that they didn’t show the price.

So the pump was nicely primed.

Questions 1 and 2

I gave out Dan’s handout and each group of 2/3 worked through it independently and I went around and poked and prodded with questions.
2014-05-08_14h05_18
Here are some quotes from the first two questions:

Question 2:

B can’t be possible because they add up to more than 100%.

(some groups got confused about the question… they were trying to figure out which distribution was the same as the ducks from the video)
Student Beta: C is the one from the video.
Student Gamma: D is also possible from the video.

Question 3

2014-05-09_11h00_39

Student Delta: I feel like A would be bad because no one would keep buying ducks.

Student Epsilon: But B would be bad because you’d be losing money.

Question 4

2014-05-09_12h16_44
The students had an easy time sorting out the most and least likely to buy for $5 (by eyeing it), but a difficult time sorting out the two middle positions. I’d say the groups were evenly split at the guesstimate for sorting the middle two. I went around to each group and asked how they sorted, and mentioned that it’d be nice if there was some way to formalize the guesses.

Questions 5 and 6

2014-05-09_12h31_06
About half the groups got calculating right away without giving a gut guess (on question 5). I didn’t help out with question 6 unless asked, just put the expected value formula up on the board. Most groups figured it out on their own.

Extension

When groups finished up, I put them in the position of the producers. Asked them to come up with:

  • Group Name (this might have been a mistake, took many groups a LONG time to pick a clever name)
  • A probability distribution
  • A price for the soap

When they came up with those three things they either entered in the information at my teacher computer, or on my chromebook.
Screen Shot 2014-05-11 at 2.42.05 PM
When they were finished with entering in the information I asked them to step away from their companies goal, and become individual buyers of the soap. Which would they buy… and why?
These students quickly found out that they had to do a bunch more calculations of expected value, and they were becoming bored with this calculation. Thankfully spreadsheets are both fast and accurate at calculations, so I put in the required formulas and calculated the expected values…
Screen Shot 2014-05-11 at 2.42.29 PM
Screen Shot 2014-05-11 at 2.42.36 PM
Interestingly a couple of groups either went down the route of a non-profit (but not really) corporation, or they didn’t understand how to properly set a price for their soap.
Nice activity, a nice extension might be to go from the theoretical to the empirical world by actually “making” the ducks, and seeing how the gambling buying of the soap actually turns out.

Posted in Full Posts | 5 Comments

Edward Frenkel on Math and Beauty

Edward Frenkel, author of Love and Math, was on The Colbert Report.
Here’s a transcript of an especially interesting segment:

Edward Frenkel: When you say that you hate math, you’re really saying I hate the way math was taught to me. Imagine you’re in art class in which they only teach you how to paint a fence or a walk but they never show you the paintings of the great masters. Then of course years later you’re going to say “I hate Art”, what you’ll really be saying is “I hate painting the fence.” And so it is with math. When people say “I hate math”, what they’re really saying is “I hate painting the fence.”

Stephen Colbert: But in math, don’t I have to know a fair amount of the high end math to appreciate the work of the masters? It’s almost as if you can show me the painting of the masters, but I don’t have eyeballs yet. Don’t you have to grow the math eyeballs to see the equations as beautiful?

Edward Frenkel: That’s our job. …

Posted in interesting stuff | 1 Comment

Mandelbrot Fractal v2

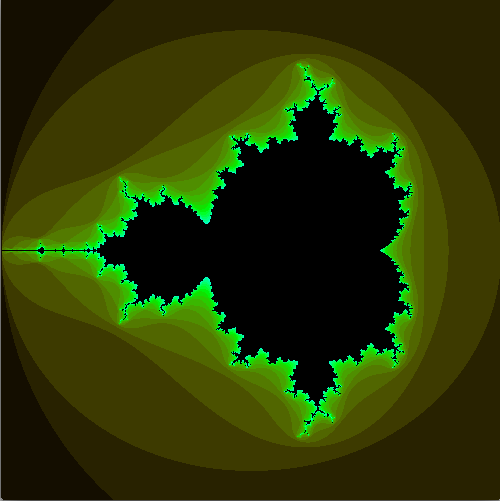
I had so much fun with the original Mandelbrot program that I decided to see if I could improve it. I was amazed by how easily I was able to generate a fractal picture that looked exactly like other pictures online. I didn’t look at anyone else’s code, just went down the path and the amazing Mandelbrot just happened.

Before You Read, Play

Click here to play with it in your web browser.

Ok, now that you’re back: here are some new “features” that were implemented, and the interesting math that happened:

Zooming

Left click to zoom in on that point (70% smaller window). Right click to zoom out ( 1/0.7 = 143% bigger window).

The first problem that I had with zooming was the conflict of the virtual coordinate complex plane (-2.0<x<2.0 and -2.0<y<2.0) and the processing.org window (0<width<500 pixels and 0<height<500 pixels, with the height pixels arranged from top to bottom (instead of bottom to top).

2014-04-04_14h13_02

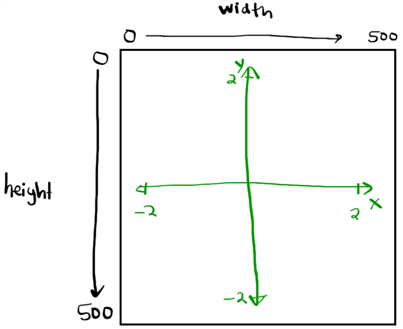
After much brooding, lots of print(variable_name_here)s, lots of sketching on paper, and finally changing a + to a or  to a +, the zooming finally worked as desired. The code is more ugly than I’d normally like, but it’s generalized so you can change the resolution to whatever you’d like and it should work.
Here’s the processing code that takes a 1D pixel array (0 to 250,000) and produces each complex coordinate:

  loadPixels();
  color c;
  float windowwidth = maxwindowx - minwindowx;
  float windowheight = maxwindowy - minwindowy;
  for (int i = 0; i < pixels.length; i++)
  {
    //this code maps the one dimensional pixel array to a cx and cy in the complex plane
    float startcx = windowwidth * (float(i % width) / width) - (windowwidth/2) + centerx; 
    float startcy = windowheight * (float(floor(float(i)/width))/height) - (windowheight/2) + centery;

The interesting math to get 2D information from a 1D array is here:

i % width
floor(i / width)

The first line gets the row (the % sign means remainder, so the 1052nd pixel is 1052 % 500 = 52, so it’s on row 52 (of 500)).
The second line gets the column (divides i and width, and rounds down, so floor(1052 / 500) = 2, so it’s on column 2.

Adaptive Resolution (and Color)

The resolution is how the program calculates the color of each pixel.

Some background: the mandelbrot set is the set of all coordinates in the complex plane (x is reals, y is imaginary), c=a+bi, where if you start with the complex number z=0+0i, and iterate the following operation:
z := z^2 + c
The resultant complex number stays with a size (modulus) of less than or equal to 2. So in otherwords, if c = 0+0i, then z^2+c will always have a size of less than 2. Color this point black.

On the otherhand, if I start out with c=1+1i then I get the following sequence for z:

z_1 = (0+0i)^2+c = 1+1i  size <= 2, keep going.
z_2 = (1+1i)^2+c = 2i  size <= 2, keep going.
z_3 = (2i)^2+c = 1+3i  size > 2, stop.

So the complex point 1+1i fails after 3 steps. Color this point something dark because it fails somewhat quickly. If you make the rule that the longer a point goes before it fails, the lighter the color then you get something exactly like the above images. The coloring is that easy.

Here’s the coloring code:

if  (mandelvalue < 2)
    {
        c = color(0,100,0);
    }
    else
    {
        //the color of the pixel depends on how far the iteration got before it was out of bounds
        float ratio = 1.0*count/resolution;
        c = color(10+1.0*ratio*140,100,1.0*ratio*200);
    }

If the final z (mandelvalue) is less than 2, then color it black, otherwise color it based on how many cycles it took to exceed two (count). Note: this color system is based on 0 to 100 HSB color format.

A big problem that has to be dealt with is when do you stop checking to see if a point converges to <= 2 or diverges….

Here’s a video of the resolution increasing one step at a time. A resolution of 1 means that all points whose size is <= 2 after 1 step are colored black. A resolution of 50 means that all points whose size is <= 2 after 50 steps are colored black. If the point strays outside of a size of 2, then color the point dependent on how quickly it strayed.

Ok. So clearly more resolution is better right? The problem is that it’s starting to get computationally slow. 500×500 is 250,000 pixels and at a resolution of 50 each one of these pixels may need up to 50 sets of calculations.

If we’re able to zoom in, then how can we make a clear enough picture for the given window size? If the picture is really zoomed in, then we’re going to need a higher resolution to get a nice picture.

So what I need is a way to dynamically change the resolution based on the virtual window size. If the virtual window size has a width of 4 units (-2 to 2), then a resolution of 18 is pretty good. But if the virtual window size has a width of 0.2 (-1.5 to -1.3) then I need a higher resolution. I need an equation to set the resolution based on the window size. Enter regressions. I took some points and made a quadratic regression:

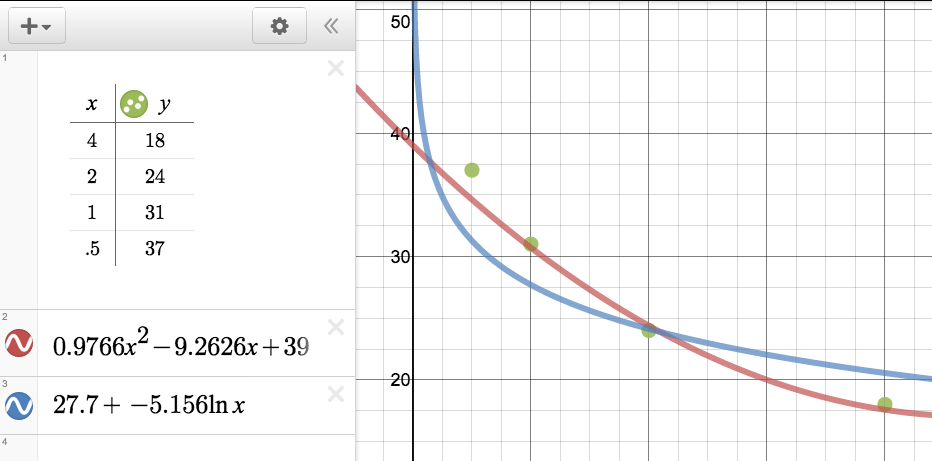
The x-axis is the windowwidth, and the y-axis is the resolution. The red graph was the first regression that I used. Not great. As the window got smaller and smaller, the increase in the resolution necessary didn’t keep up. So I went to a log regression (duh, vertical asymptote at x=0), and it picked a resolution with more accuracy.
Here’s the resulting code:

resolution = int(27.71-5.156*log(windowwidth));

Varieties of Mandelbrot

z^2+c is only one possibility.
You can try z^n+c as well. Here’s a video walk through of z^2+c, z^3+c, z^4+c, … , z^10 + c. You can try this yourself in the real program by clicking the 2, 3, 4, 5, … , 9, and 0 (10) keys:


Here’s the code for the z^2 + c and the z^3 + c using binomial expansion that was done by hand (and simplification of powers of i).
  if (power < 2.01 && power > 1.99)
  {
    fx = x*x - y*y + startcx;
    fy = 2*x*y + startcy;
  }
  else if (power < 3.01 && power > 2.99)
  {
    fx = x*x*x-3*x*y*y + startcx;
    fy = 3*x*x*y-y*y*y + startcy;
  }

But as I was going to wolframalpha to expand (a+bi)^4, I remembered DeMoivre’s Theorem. Duh. Here’s the general code:

    float r = sqrt(x*x + y*y);
    float theta = 0;
    r = pow(r,power);
    if (x > 0)
    {
      theta = atan(y/x);
    }
    else if (x<0)
    {
      theta = atan(y/x);
      theta = theta + PI;
    }
    else
    {
      theta = 0;
    }
    theta = power * theta;
    fx = r*cos(theta) + startcx;
    fy = r*sin(theta) + startcy;

This will work for any integer n for z^n+c. Great.
However this method is noticeably slower than the specific solutions. Bummer.

Why Stick to Integer Powers?

I (now) know that DeMoivre's Theorem doesn't "work" for non-integer powers, but it sort of works.
Here's a video of the fractal walking from z^2+c to z^3+c by steps up in the power of 0.05. On the live version, you can try this yourself by clicking the "Q" key to go up by 0.05, and the "A" key to go down by 0.05. Notice the vertical line right down the middle? That's due to converting a rectangular point to polar and the program is trying to get pi/2 out of a theta of arctan(some_number / some_number_thats_really_really_small). See the trouble?

Float Fail

Eventually we zoom too far down because the numbers are too small to accurately represent with a 32-bit float. Here's a picture of what happens when it eventually fails. At the bottom of the picture, I've printed out the resolution and the window width.
Screen Shot 2014-04-05 at 12.33.00 PM
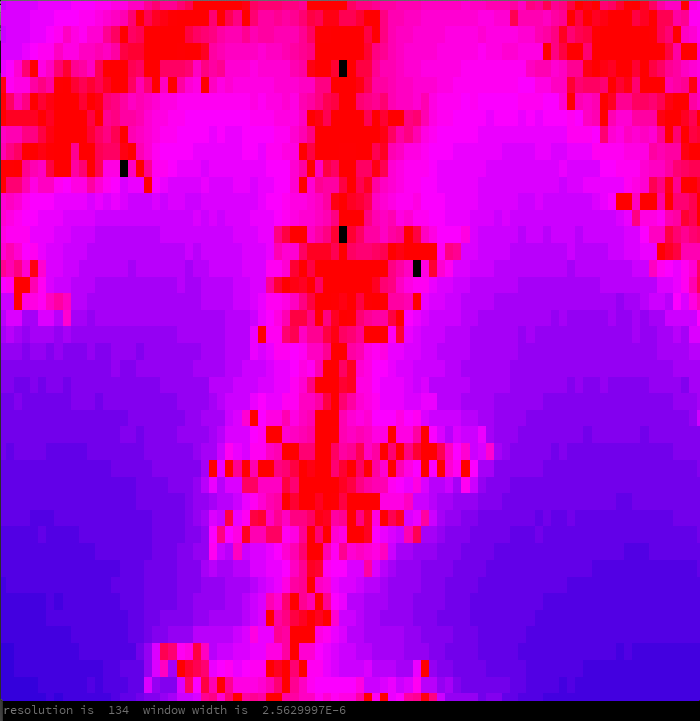
A float only can store about 7 (decimal) digits of precision, so when we're squaring the same number 134 times, the errors will eventually catch up to us.

Posted in Full Posts | Tagged , , , | 2 Comments

Mandelbrot Fractal

I was inspired by a My Favorite presentation from a student on the Mandelbrot fractal. I played around for a half hour at school without a ton of success, but I sorted out the sticking points on the way home, and finished it up tonight. Amazingly simple (the code may not look simple, but it’s all mine and most of it is setup. The actual fractal code is ~15 lines).

Screen Shot 2014-03-27 at 8.41.55 PM

Link to live openprocessing demo with source code.

Here’s the code, stripped of the color fluff.

float fx = 0;
float fy = 0;
int count;

int resolution = 18;

void setup() { 
    background(0);
    size(500, 500);
    loadPixels();
    color c;
    for (int i = 0; i < pixels.length; i++)
    {
        float startcx = 3.0 * (float(i % width) / width) - 2; //This provides a virtual x window from -2 to 1.
        float startcy = 3.0 * (float(floor(float(i)/width))/height) - 1.5; //This provides a virtual y window of -1.5 to 1.5.
        float mandelvalue = mandel(startcx,startcy);
        if  (mandelvalue < 2)  c = color(0);
        else  c = color(255);    
        pixels[i] = c;
    }
    updatePixels();
}

void draw() 
{
}

float mandel(float startcx, float startcy)
{
    float xm = 0;
    float ym = 0;
    count = 0;
    fx = 0;
    fy = 0;
    while ((count < resolution) && (fx*fx+fy*fy < 4))
    {
        func(xm,ym,startcx,startcy);
        xm = fx;
        ym = fy;
        count++;
    }
    return sqrt(fx*fx + fy*fy);
}

void func(float x, float y, float startcx, float startcy)
{
    // this squares the complex number x+yi, and then adds the constant
    fx = x*x - y*y + startcx;
    fy = 2*x*y + startcy;
}
Posted in Full Posts | Tagged , , , | 1 Comment