Tracking Venus and Earth over 8 years
May 19, 2015, 12:00 amI came about this tweet:
https://twitter.com/SciencePorn/status/599718978307620864/
It reminded me strongly of the waning moon and linear mod art projects that I’ve been playing with.
For instance, here’s a screenshot from the waning moon (specifically y = 56x)
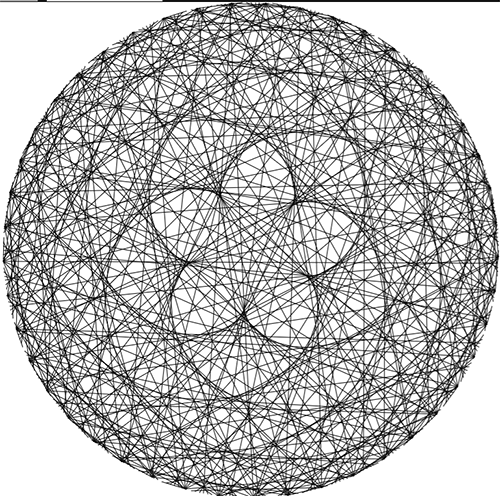
A quick intro: the picture above was made by taking 360 points around a circle, and shifting them by the function (y = 56x), and then graphing a line between the input and output. If the output is greater than 360, then take the remainder after dividing by 360.
From lunar planner.
And from John Carlos Baez’s blog:
It’s called the pentagram of Venus, because it has 5 ‘lobes’ where Venus makes its closest approach to Earth. At each closest approach, Venus move backwards compared to its usual motion across the sky: this is called retrograde motion.
Actually, what I just said is only approximately true. The Earth orbits the Sun once every
365.256
days. Venus orbits the Sun once every
224.701
days. So, Venus orbits the Sun in
224.701 / 365.256 ≈ 0.615187
Earth years. And here’s the cool coincidence:
8/13 ≈ 0.615385
That’s pretty close! So in 8 Earth years, Venus goes around the Sun almost 13 times. Actually, it goes around 13.004 times.
Hey do you recognize what that ratio is close to?
Anyway, there’s a lot to investigate here. How is the function y = 56x related to these planetary orbits?