Mathematician Once Removed

This post is part of the Virtual Conference on Mathematical Flavors, and is part of a group thinking about different cultures within mathematics, and how those relate to teaching. Our group draws its initial inspiration from writing by mathematicians that describe different camps and cultures — from problem solvers and theorists, musicians and artists, explorers, alchemists and wrestlers, to “makers of patterns.” Are each of these cultures represented in the math curriculum? Do different teachers emphasize different aspects of mathematics? Are all of these ways of thinking about math useful when thinking about teaching, or are some of them harmful? These are the sorts of questions our group is asking.

Anna Blinstein and Michael Pershan asked us to respond to a prompt so we could have a set of posts for this Virtual Conference. The essay was “The Two Cultures of Mathematics,” by mathematician W. T. Gowers. Gowers breaks down pure mathematicians into essentially two categories based on their beliefs:

  1. The point of solving problems is to understand mathematics better.
  2. The point of understanding mathematics is to become better able to solve problems.

Caveat: I didn’t read the essay in much depth, and I’m sure that I’m purposely misinterpreting his conclusions. That’s ok with me, but don’t go rioting outside Gowers’ door because of this silly blog post.

I find it interesting for Gowers to define the culture of math and hence the culture of mathematicians with the *solving problems* lens. While it’s not an inclusive definition of what a mathematician, I’m ok with that, it’s a good place to start. But am I a mathematician by this definition? I don’t solve novel math problems, I’ve only ever solved problems that someone else has already solved (with exception of something personal, like how long can I make this $20 last at the horse track). Nor do I build theory or structure to help others solve novel problems. I teach teenagers how to use centuries and sometimes millenia old math to solve problems that have already been solved.

At best I’m a mathematician once removed, I teach those who might go on to solve novel problems on their own (although, as far as I know, none of the roughly thousand students that I’ve taught have done so). I don’t think that I’m one of the shoulders that these students are standing on if they become mathematicians, but I am lending a hand for them to boost up to a slightly higher position.

And I’m ok with this definition of a mathematician, it doesn’t bother me much one way or the other. I play with math. I make things with math. I teach math. But I’m certainly not solving new problems or creating structure to solve those problems.

Why am I ok with this? Because when I solve a problem that I’ve never solved before, it’s still new to me. It doesn’t take too much of the enjoyment away from me to know can I buy prednisone over the counter in USA that millions of people have already solved this problem. Likewise, I don’t find it less enjoyable to hike a mountain that someone has already conquered: it’s still a new view for me to take in, a challenge for my body to take on, etc.

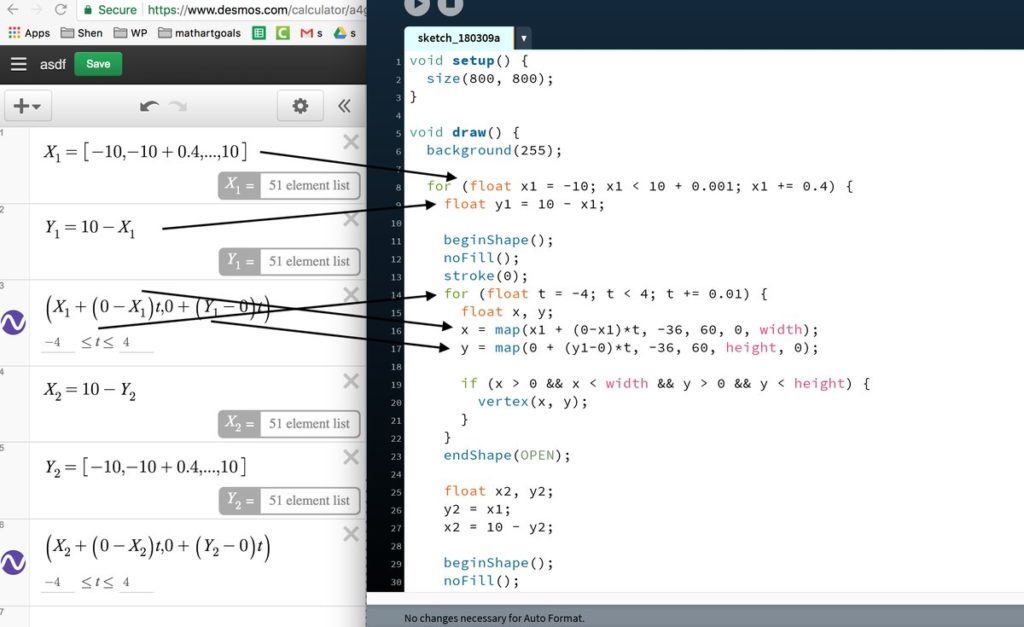
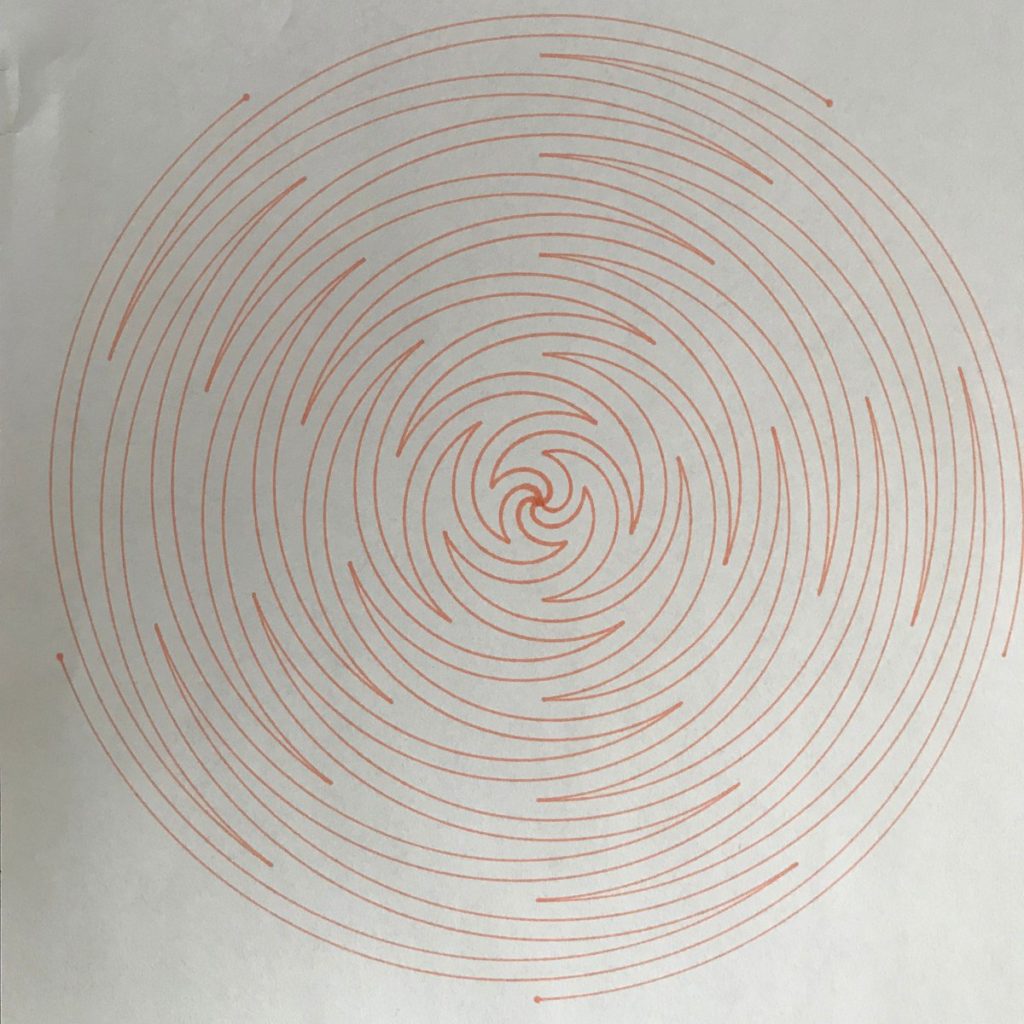
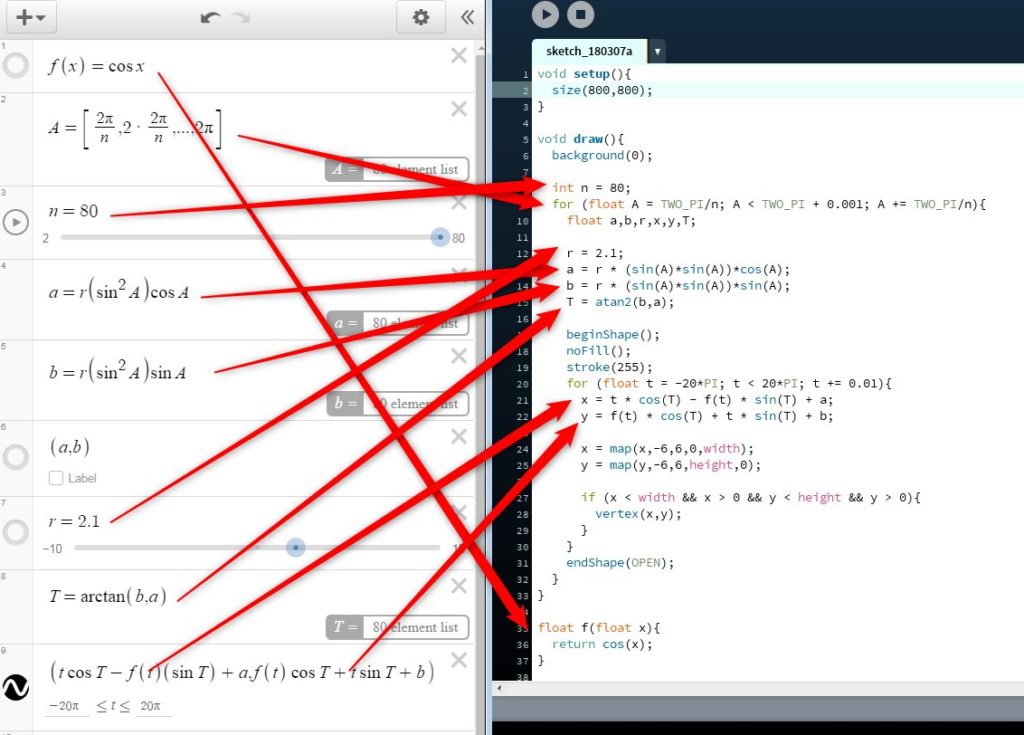
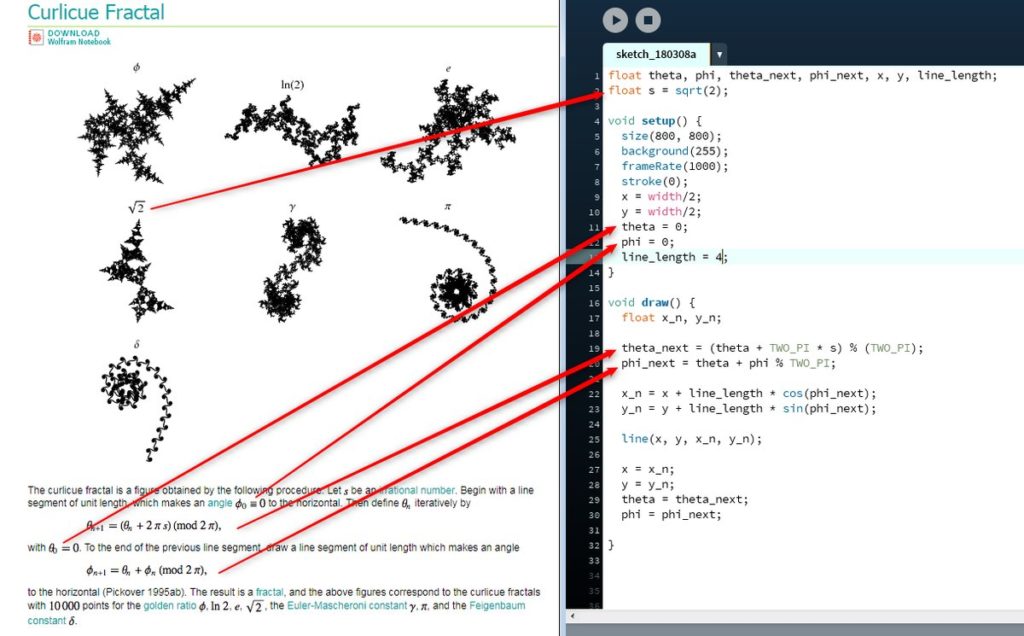
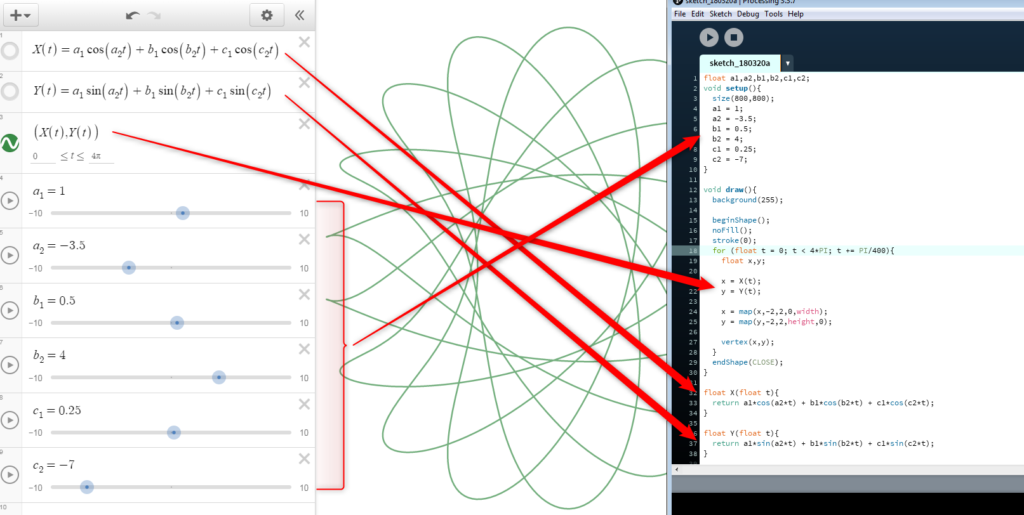
I also find a lot of value in solving a problem that someone else has already solved because then I can compare approaches to the solution. When I see a really cool math idea scroll across twitter, I often see if I can replicate that math with some sort of computer program. I’m not doing anything new to humanity, but it’s new to me, and that’s what’s important! Similarly, when we as math teachers can get kids genuinely interested in some variety of math (even if it’s not on the curriculum), we are making a difference. If it’s new to those kids, then that’s all that matters.


Posted in Full Posts | 1 Comment

Learn to Code through Math #learntocodethroughmath

The #learntocodethroughmath project is something that I created sort of by accident. I see the audience for this project as someone who is somewhat comfortable with using Desmos to create math-artsy stuff with lists, functions, and parametric functions and is interested in learning how to code using Processing. So yea, pretty narrow. But hopefully fruitful and inspiring!

Here’s the original tweet that started things off:

Click on that tweet to see the three tweets in that thread. I’ll add more to that thread as time goes on.

Here is another set of tweets that ignited the project.

(To avoid twitter dying and killing my content, I’ll post the images from those tweets here too)

Tweet 1:

Tweet 2:

Tweet 3:

Tweet 4:

Tweet 5:


Tweet 6:

Tweet 7:

Posted in Full Posts | Tagged , , , , | Leave a comment

The Rough-Draft Move

I’m baaaaaaack. My last post on this blog was six months ago, and that’s a shame. I’m shifting my “writing bucks” from the photo180 blog over to this blog. Some posts will feel a little photo180-y, but most will be more “fully featured”. 

Removing friction from the learning cycle in a classroom is super important. Whiteboards, group work and overall positive classroom culture geared towards taking risks and helping each other out can go a long way. Dan Meyer recently blogged about the classroom move of rough-draft talk. Although it was a small change to my normal classroom routine, it paid off quite well. I asked the students to make a rough-draft of a trig graph that we were working on. This was still early days with trig graphing, but after a four minute rough draft session, the students were ready to talk about the graph. Every graph in the room had things to build off of, and every set of students had a productive conversation about what to draw. They were all coming from somewhere positive. This is a classroom routine that I think will stick with me.

Posted in Full Posts | Leave a comment

PAEMST State Finalist

I’m happy to let you all know that I’m a New York State finalist for the Presidential Award for Excellence in Math and Science Teaching (PAEMST). I worked on the application this past spring. I enjoyed the reflective nature of the application; it required a detailed description of a recorded lesson, and also a detailed explanation of my overall teaching philosophy. I’m not sure how many finalists have been selected in New York (probably 3 math and 3 science), of which they’ll give the award to at most two teachers from New York next year in Washington DC. Best of luck to all!


Posted in interesting stuff | 8 Comments

Classroom Top Four – #2 Whiteboards and Furniture

This is the second in a series of four posts that describes my favorite things that I’ve done in the classroom to improve my teaching. The first post on Course Evaluations can be found here.

2. Whiteboards and Furniture

On my classroom photo blog, photo180.recursiveprocess.com, I’ve written a LOT about my class’s whiteboard use. In this post I’ll share and expand on what changes have happened in the classroom because of the shifts towards whiteboarding and better furniture.

There were two kernels to the start of the use of whiteboards in my classroom: Frank Noschese’s The $2 Interactive Whiteboard and Alex Overwijk’s Vertical Non-Permanent Writing Surfaces and Visible Random Groupings. (VNPS and VRG).

I encouraged our high school to buy enough whiteboards for every classroom in our high school.

Why Whiteboards?

Peter Liljedahl has done research on the use of VNPS, and some of it can be found here. Here are some things that I’ve noticed after my class has changed over to working on problems on whiteboards (standing or seated).

  • the students are quicker to start a task (supports research)
  • they are more willing to take risks (supports research)
  • they work longer on a task (supports research)
  • they communicate more with partners (supports research)
  • students who struggle on a topic are actively supported by their group members with little prompting from teacher
  • students who normally fly through a problem (often making mistakes along the way) are more careful and make less mistakes
  • related, students who have a strong knowledge base get even stronger, because of the required communication between peers, they are explaining their thinking and trying to formalize their thinking through making generalizations and conclusions
  • if they are vertical whiteboards, then I can more quickly address conceptual errors by seeing an error from across the room
  • groups self check their work against other groups and naturally compare their work to the neighboring groups
  • through more intentional gallery walks (though this is tough with larger classes) and sharing by taking pictures and putting them up on the projector, every student can see the numerous different ways that are available to solve a problem, and can make some judgments about which they prefer

I’ve really enjoyed using VNPS to both challenge students with stronger knowledge and support those with less understanding. Confirming some of the research, I’ve noticed a massive positive shift in my classroom when I’ve changed to this kind of work in class. It’s been important for properly challenging students who have less understanding on a topic because they are more willing and able to jump into a problem that they would have struggled with by themselves. They have a built-in support system of the teacher, but more importantly they also have a support system with their partners who might have more understanding in a topic. Their partners can explain things in new and different ways compared to a teacher because they themselves have just learned the topic, as opposed to relying on the teacher who learned the topic before they were born!

The other important part of Liljedahl’s research is the use of randomized grouping. Because the groups change based on a transparent and random nature every two weeks, every student gets the opportunity to work with just about everyone else in their class. Students who have more understanding need to effectively communicate their thinking to a peers with slightly less understanding. As anyone who has taught someone else knows, you often don’t truly understand a topic until you can explain it to someone else.

Furniture

This is a subtle thing, but after being in a room with tables and chairs that move around easily (and can be separated), I think I would have trouble going back to a room of these:

It’s been very freeing for the encouragement of group work to be able to quickly go to “battle stations with whiteboards” (although this picture doesn’t show whiteboards, it’s the only pic I could find)

If they’re looking at the projector screen (or often if they’re doing problems on the seated whiteboards mostly by themselves) then we’re in this setup:

I’ve tried groups of 2 and 4, but have settled in on groups of 3 after their written feedback asking for their preferences.

You probably have much more control over the first of these two changes, but both of them have been very nice shifts to my classroom. For those who have played with either of these two classroom ideas, what have you found to be helpful? What are the next things that I should try with regards to whiteboards or furniture?

Posted in Full Posts | 1 Comment

Classroom Top Four – #1 Course Evaluations

This is the first in a series of four posts that describes my favorite things that I’ve done in the classroom to improve my teaching. This post was cross-posted on my photo 180 blog

1. Course Evaluations

Have you ever tried to swim in a lap pool with your eyes closed? How long were you able to go without hitting a lane divider? I can get about 5 or 6 strokes in before I hit and need to correct my direction. I’ve done some triathlons, and one of the hardest parts of racing is swimming in a straight line. You can train all you’d like on lanes, looking down at a lane marker to go straight, but swimming in open water is a different challenge. The thing that worked best for me was to take some number of strokes, say 10, and then take a look to make sure you’re pointing in the right direction. As your muscles get more tired you tend to wander in different directions.

I’ve been asking my students for quarterly feedback for 4 or 5 years, and I’d put it in the top three changes that I’ve made that have most affected my teaching. I use the feedback to keep me honest. It’s hard to open up to anonymous feedback from teenagers, you think the worst is going to happen. But I’ve found that not only do they give marvelous feedback (“course” correction, do you see what I did there), but they tend to appreciate the addition of another data point that you give a damn, and that their input matters to you. There is so much good stuff that they have to say, and if you provide them time, space, and importantly, optional anonymity; they will hand you pure gold. It doesn’t have to be a long feedback form, my quarterly feedback form is only 6 questions:

Here are some quotes from this past feedback session, for some context, these are Juniors and Seniors in advanced math classes.

I love how in depth they think about how they learn best, and they definitely don’t all agree on their favorite methods. I love how they give me constructive feedback and compliments in the same response. I also deeply appreciate their pushback on thing that we need to work on as a class. And this isn’t some royal “we” going on here, they often see changes that they themselves can make to improve their learning (not that they always take themselves up on their own advice!)

An important part of this feedback cycle is to acknowledge their responses publicly. I like to try and get the gist of each question and write down my takeaways. I also think it’s useful to take a comment that I disagree with and explain my thinking. For example, there is a group of students who would rather I was more flexible with my reassessment policy. I explain to them that I wish I had a time turner because then I could provide each and every student as many opportunities as they needed to prove their knowledge on a topic.


I hope you can find a time to try something similar in your classes. It’s hard to not focus on a negative bit of feedback, but I’ve found that I’ve gotten ever so slightly better at seeing the big picture. You gotta bang into some lane dividers to keep your path.

Posted in Full Posts | 3 Comments

Workflow: Processing -> Fiji -> 3D Print

This is an extension off a previous workflow series featuring Processing and Fiji

b9368384-1666-40a5-b770-2f9664b5c2fa

8e0bd16e-063d-43b2-9bc1-722c94aab9b7

ezgif-com-optimize

ezgif-com-resize

This 3D print has slices that represent a (linear) trip in the Julia Set from 0+0i to 0.32+0.64i. I wrote a Processing program to create the 400 Julia slices and then Fiji stitched the 2d images together into a 3D model. Here’s the interactive mandelbrot -> julia program that is featured in the last gif.  The printer is a resin based SLA model (prints from liquid goo!).

Posted in Full Posts | Leave a comment

Play with Math

Learning ∩ Play ∩ Math ∩ Art

The connection between learning math and playing with math has been on my mind lately. Another connection that I’ve been thinking about is the interplay between math and art. This morning I decided to merge these two thoughts. I originally tweeted under the hashtag #playeveryday, but future challenges like these will be under the hashtag #playwithmath. Through exploring a graph in Desmos, can we both learn some math and make some interesting images?

Here is some great work by some tweeps:

cu-jgj5weaqixul

Your Turn

What can you make? Can you learn some math by playing around?

Posted in Full Posts | Leave a comment

Workflow: Desmos -> Selva3d -> 3D Printer (in 5 minutes!)

This is a continuation of the workflow series: part 1part 2, and part 3

This workflow was done entirely in the web browser and could be done on a chromebook. The only step that requires a more serious computer is sending the file to your 3D printer. Also, writing up this blog post took three times longer than the actual workflow!

Step 1: Desmos

Make a design in Desmos, turn off grid and axes and take a screenshot. Here’s the design that I worked with, and the screenshot that I used. I have the function listed twice so that the design was fully black, but I don’t think this would have mattered.
2016-09-21_08h07_43 2016-09-21_07h48_28

Step 2: Selva3d

Go to Selva3d and register for an account. Upload your screenshot and it will extrude it for you. Download the 3D file.

2016-09-21_08h10_30

Note, if you want slightly higher quality (for free), you can bring the image to inkscape, convert it to svg, and bring the svg file to tinkercad. This requires you to install software, but there are also online png -> svg converters. It’s one more step for a bit more quality.

2016-09-21_08h13_31

Step 3: 3D Printer

Bring the file to your 3D printing software for final tweaks. After 1 hour of printing, here’s the result!

fullsizerender

Sidenote, selva3d has some cool partners. Here you can very easily order a phone case with your design on it for $21.

2016-09-21_08h36_38


Posted in Full Posts | Tagged | 1 Comment

Workflow: Desmos -> Inkscape -> Laser Cutter

This is a continuation of the workflow series: part 1 and part 2.

Motivation

Have students create mathematical art in Desmos and bring that digital art into the physical world using a laser engraver. You can certainly bring any image from Desmos and engrave it into an object using a laser engraver, but this method allows you to cut out the actual line from the material so that all that is left is the shaded area.

Desmos

Create a design in desmos that has lines which are crossing at points. This method will use the laser to cut on each side of a line, so that the material “inside” the line will remain.

Here’s an example: Wavy Sine Circles. Turn projector mode on.

Screen Shot 2016-08-20 at 2.48.17 PM copy


Take a screenshot of your image.

Inkscape

Open the image with Inkscape (free and open source vector image editor), and then select the image by clicking on it.


Screen Shot 2016-08-20 at 2.49.28 PM copy

Go to Path -> Trace Bitmap.

Select Edge Detection. This selection will make vector lines on each edge of our original image.

Screen Shot 2016-08-20 at 2.50.05 PM copy

Drag one of the images sideways so that you can delete the original image and just have the vector image left.

Screen Shot 2016-08-20 at 2.50.20 PM copy

Save the vector as a .svg file so that your laser cutter will be able to follow the lines directly (Vector vs Pixel images).

Screen Shot 2016-08-20 at 3.16.59 PM copy

This output looks a bit “lacy” for most materials that I’d use in the laser cutter. The lines are too narrow. No problem, do the same steps with the original desmos image, but this time zoom out before you take your screenshot. Desmos will always make it’s lines a certain width, so if you zoom out, the lines will be relatively thicker. Here’s the result after a quick zoom out.

Screen Shot 2016-08-20 at 3.17.21 PM copy

Laser Time

Bring your .svg file to the laser cutter that you have available (or to a vinyl sticker cutter). Here are some results (these are test cuts on manila folders):

image_01-1

image_01

image_01-5 image_02

What do you think students could make with this workflow?


UPDATE

I’ve had some trouble with the output from inkscape giving me double lines, so that the laser is making two cuts really close to each other. Here’s a fix.

When you go to trace the bitmap, keep the selection on brightness cutoff.

2016-09-21_14h59_42

Result:

2016-09-21_15h00_00

Move the vector off of the original image and delete the original image (the one that is fuzzy).


2016-09-21_14h59_52

Change the fill and stroke to the following: No fill, black stroke.

2016-09-21_15h00_07

2016-09-21_15h05_47 2016-09-21_15h05_51

2016-09-21_15h00_20

Send to your laser cutter software. Much better!

2016-09-21_15h01_05

Posted in Full Posts | Leave a comment