If you had a friend taking this class next year, what advice would you give them?

I asked the above question, If you had a friend taking this class next year, what advice would you give them?, to the outgoing PreCalculus H group last year. I’m giving the incoming PreCalculus H their responses. Here’s a link to all the responses, and here are some of the absolute jewels. (No editing was done on this document, exactly how the students responded, mistakes and all.)

  • Use your classmates for help and work together
  • Good luck….even though homework’s aren’t graded make sure to actually DO them fully because if you don’t you’ll fall so behind….and retake as much as you can
  • To study A LOT and with a group of people so that if you have any questions you guys can talk about it together.
  • Also, you need to practice and study on your own if you do not understand something because it will catch up to you. You will not do well on the B quizzes if you don’t fully understand the material. If studying on your own doesn’t work, get extra help from a teacher.
  • There’s a lot of material you will cover in this course, and you want to be able to look back on it at the end of the quarter / year. This course will never be easy, but it is manageable. Reassess every opportunity you get, even if it’s just a 4.5. If your scared you’ll lower your grade if you get a 4.5, you probably don’t know the material as well as your grade shows that you do, and you’ll suffer at the end of the quarter because of it.
  • Take take homes seriously and do them with your friends, though never just copy what they have down. Though the skills on a take home are much more complex that what you need to do in class, they are skills you need to buy prednisone online Australia relatively comfortable with, and they actually do help a lot. If you don’t understand anything that you wrote down, stay after with Danderson and review the concepts. He can’t help you with the take home, but he can help you with the skills to do it (skills that you will need come midterm / final).
  • Don’t be afraid to rely on people. You aren’t going to be able to get through this class alone even if you are like a math whiz.

thats-gold-jerry-gold-kenny-bania-seinfeld-quote

Posted in Full Posts | Leave a comment

Workflow: Desmos -> Processing -> Fiji -> 3D Print

Note: this post is a more advanced version of the previous post and uses slightly different software. All this software is free and open-source.
In this post I’m going to outline how to use a workflow to go from a desmos sketch to a processing sketch to Fiji to a 3D file. The basic idea of the workflow is based on the idea of looking at a 3D object as a 2D image which is changed through time. Here’s a gif (source) that shows how we can view a cube (a 3D object) as a 2D slice.

cuicse

So if we can create the 2D sketch, then we can create the 3D object with Fiji. Here’s a video that contains a walkthrough of all the steps involved in this process in more detail.

Desmos Sketch

I used Desmos as a tool for quickly prototyping the 2D sketch. The original idea was to make a wavy cup. So the cup would start with a circle base, and slowly change up the walls to have a wavy top. Here’s the desmos sketch that shows the cup being sliced from the bottom to the top:

gifsmos

(There is more detail on how this sketch was created in the video.)

Processing Sketch

Next, we can bring the sketch to Processing so that we can easily save a bunch of frames and have a lot of control over all the details. Here’s the live code (had to be modified for openprocessing because PShape isn’t supported in JS), and here’s the original code. Once again, much more detail is available in the video.

ezgif.com-video-to-gif

Fiji

Next bring the 400 frames into Fiji. Fiji is often used for stitching 2D images from MRI machines into 3D objects.

Screen Shot 2016-07-07 at 2.06.36 PM

MeshLab

This is an optional step for shrinking the number of triangles used, and hence shrinking the model size.

3D Print

Shown with Makerbot, but every 3D printer has software that can do these steps.

Screen Shot 2016-07-07 at 2.09.28 PM

and two hours later:

IMG_4668

More Wavy Cups

These both use a different period for the sine function, and the second adds in a sine inside the first sine based on the height to give it the “wiggle” back and forth.

IMG_4670 IMG_4669

Spiral Ball

These were teased in a couple of tweets, the concept is the same as the wavy cup, but the size of each slice is controlled by a circle function. The desmos sketches are linked in the tweets.

IMG_4671 IMG_4673 IMG_4677

The black spiral ball uses consecutive fibonacci periods spinning in different directions, which is why it looks like a pine cone.

Fresnel Lens Sphere

Here’s the desmos sketch for this (admittedly weird model).

gifsmos (1)

Screen Shot 2016-07-07 at 2.36.49 PM

Dragon Fractal

These were directly coded in processing, here’s the originating code to make the fractal.

IMG_4678 IMG_4679

Let me know if you know of a different way of making this kind of 3d model! It works pretty well, but there are some rough edges with taking the 2D images to make the 3D model. Cheers!

Posted in Full Posts | Leave a comment

Workflow: Daily Desmos -> Desmos -> Madeup -> 3D Print

The seniors don’t go to school on the last day, so I had calculus class on Friday with one student (a junior). We went down to the innovations lab to create things. Here’s what we worked on:

Took this sketch from dailydesmos:

2016-04-21_07h38_06

I had the student work on the solution after talking about superellipses (or the better name, squircles).

When he finished the solution, we modified it to get this sketch:

dwabvz8q0t

and we decided to try and get a 3D print of this sketch. We started working in madeup (a fantastic beta of a program that takes code and creates 3D models), but found it tricky to graph the function. Went back to desmos to get this sketch where we could figure out how to get the specific coordinates of points along the curve.

cp6i3eokwg

Fiddled around for a bit to get this result:
ezgif.com-optimize (1)

Here’s the code:

to abs x = if x > 0 then x else -x

to func t_ a_
  if (t_ < 0)
    t_ = t_ * -1
  end
  out = a_ - t_ ^ 4
  if (out < 0)
    out = abs out
    out = out ^ (0.2)
    out = - out
  else 
    out = out ^ (0.2)
  end
  out
end


a = 20
h = 0
while a > 0
    t = -3
    while t < 3
        x = t
        y = func t,a
        moveto x,y,h
        t = t + 0.025
    end
    h = h + 0.1
    extrude 0,0,1,-0.1
    a = a - 1
end

Then click on the solidify button and download the model.

2016-06-13_10h44_39

Send to makerbot, and pick up first thing monday!

FullSizeRender


Posted in Full Posts | 4 Comments

Thoughts on the Intersection of Math and Programming

I’ve been interested in the intersection between Math and Programming ever since I taught my first programming course 12 years ago (call it coding, CS, whatever you’d like). I think I’m finally starting to figure it out. Maybe. I was prodded by Dan Meyer and Julia Tsygan to think more in detail about this intersection:

Failures

I’ve failed at teaching math topics directly through programming in math class. Maybe it’s a symptom of teaching math courses that are CHOCK full of material (IB PreCalculus Honors, and IB Calculus HL), but I just don’t seem to have the time to have the students work through the material at an appropriate rate. Or I’ve picked bad topics to try and teach through programming. Or it’s been a challenge to adapt to the different levels of student programming knowledge coming into math class. I don’t know. I’ve tried teaching arithmetic and geometric sequences and series with Python and loops, and I’ve tried teaching some probability through Python. No luck. I think it boiled down to the following problem:

  • It’s tough to teach programming concepts AND sequences and series without taking a long time to build up. How can you (quickly) learn whether or not a series converges without having first understanding how a loop works, how variables work, and maybe how conditionals work. For example, this line of code, while easy for a programmer to understand, is *really* confusing for a new programmer in math class
    x = x + 1

    This line of code takes the current value of x, adds one, then stores it back into the variable x. “=” in most programming languages is an assignment operator, and “==” is an equality operator. Ich.

Small Successes

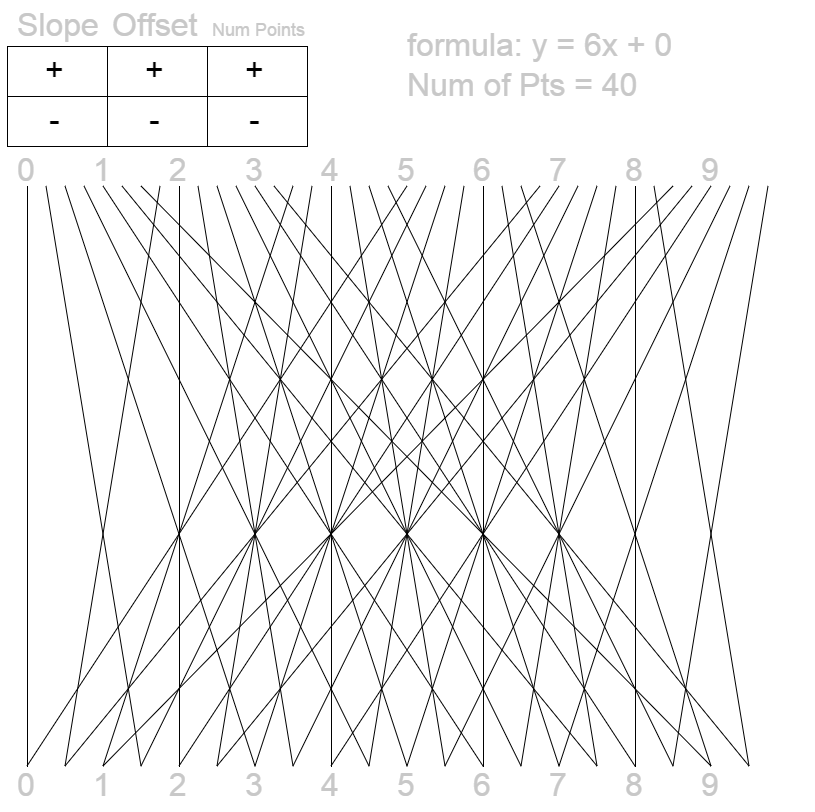
I think there ARE ways to teach a bit of math through programming. I just think that it’s use is limited. I presented on one of these topics at NCTM’s Annual Meeting in April of 2016, and at Twitter Math Camp in July 2015. All my resources are found here: Geometry from Scratch. Click through to get more details, but it boils down to the idea that you can be successful teaching Geometry or Middle School students about angles and polygons by having them use focused play in Scratch. They’ll discover the Exterior Angle Theorem after they’re asked to draw a hexagon. Likewise you can teach Geometry, Algebra, or Middle School students about slopes and lines by having them draw lines by making stairs.

Can you teach a big part of the math curriculum through programming in math class? Sure! In the same amount of class time? Nope!

Larger Successes

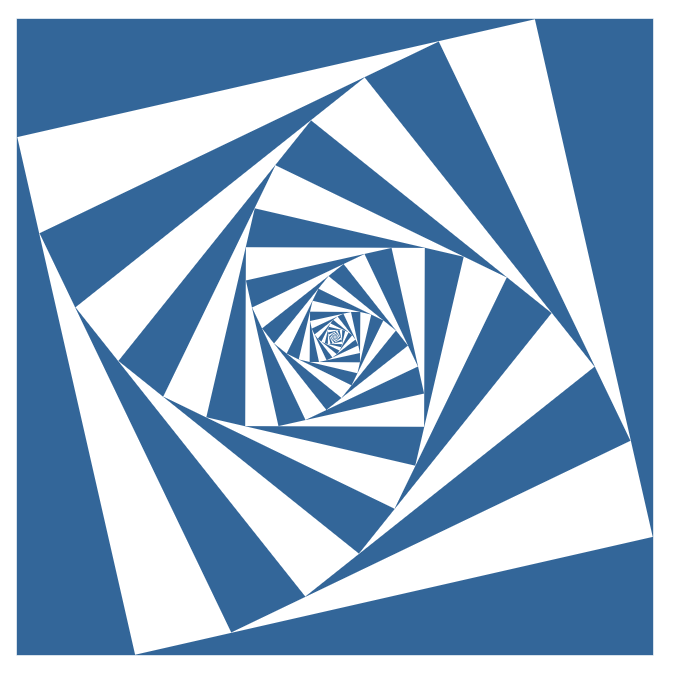
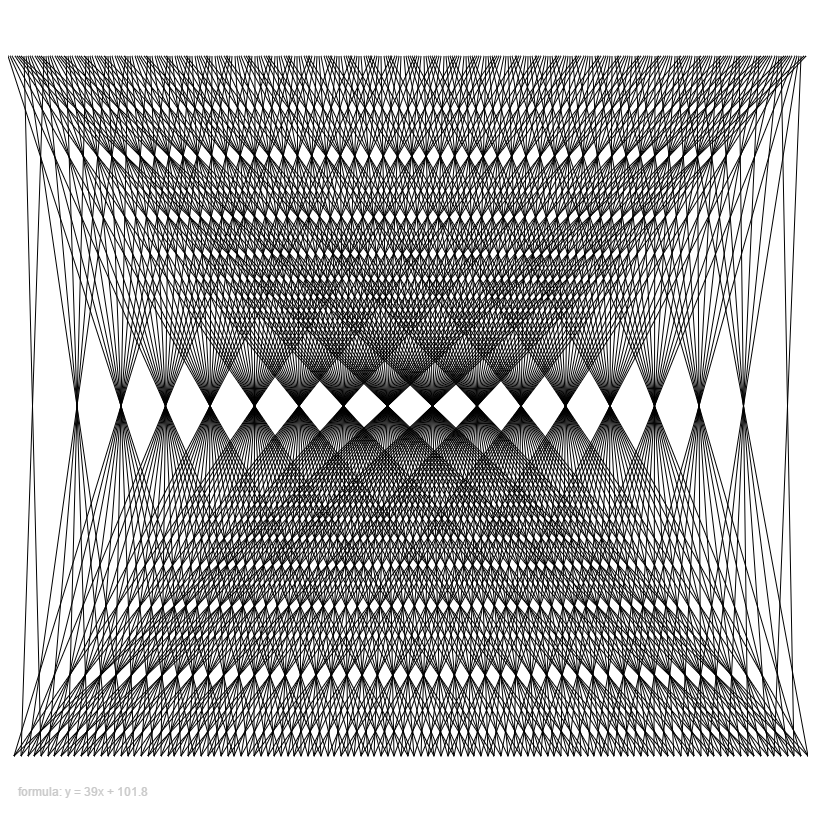
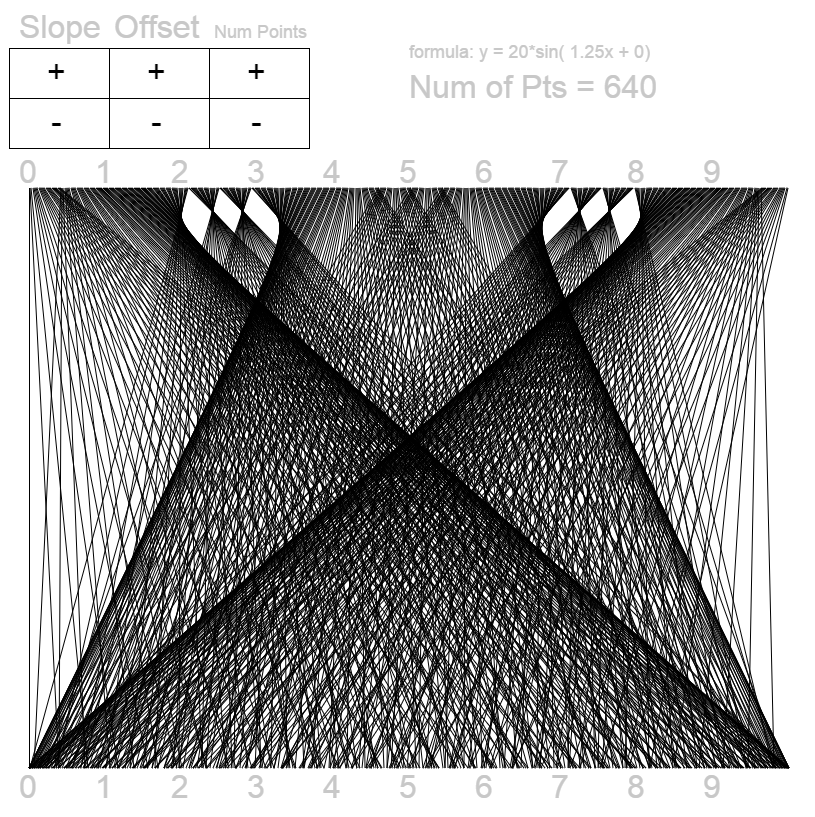
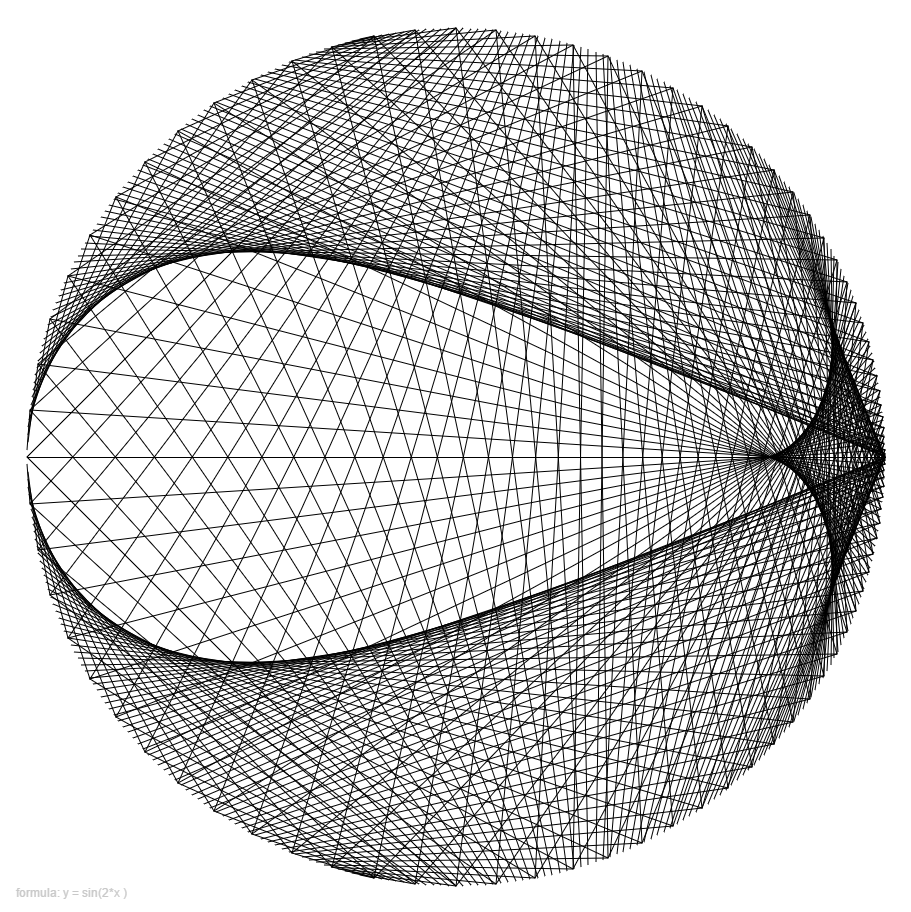
I think the biggest gain can be found by teaching math topics in programming classes. The sticking point? They might all learn DIFFERENT math topics. At the end of our programming class, I give the students about 4 weeks to work on whatever project that they’d like. It’s graded on a loose rubric that is just looking for programming milestones. Out of a class of 16 students this year, here is a subset of their work when it came to learning and applying math topics to their work. Keep in mind, I gave no guidance to them learning math topics, these came up naturally from our previous work, and after they saw some examples of mathematical computer art (more on this later? Future blog post?)

FullSizeRender (1)

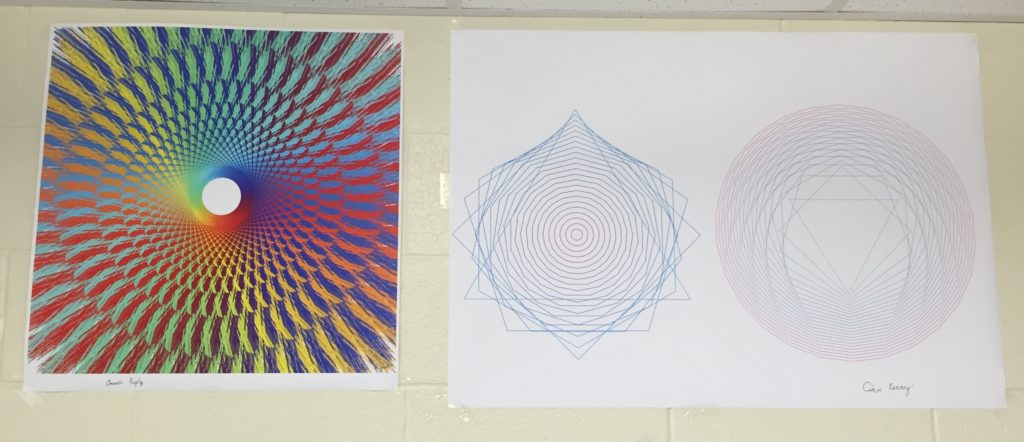
(This is my student math art gallery that just started!)

The left picture is from a student who was having trouble landing on a specific topic and so just ended up making many smaller ideas into one project. You can read more in her blog post.

Here’s some code from her (all completely from scratch):

 while (theta < 4*PI) {
    x = r*cos(theta);
    y = r*sin(theta);
    z = 2*r*cos((theta+PI/25));//finds the new point that the line should go to
    s = 2*r*sin((theta+PI/25));
    x = map(x, -400, 400, 0, width);
    y = map(y, -400, 400, 0, width);
    z = x-z;
    s = y-s;
    lines(x,y,z,s);//calls the function lines
    theta = theta + PI/25;//repeats it until theta = 4PI so that the lines go in a circle
    }

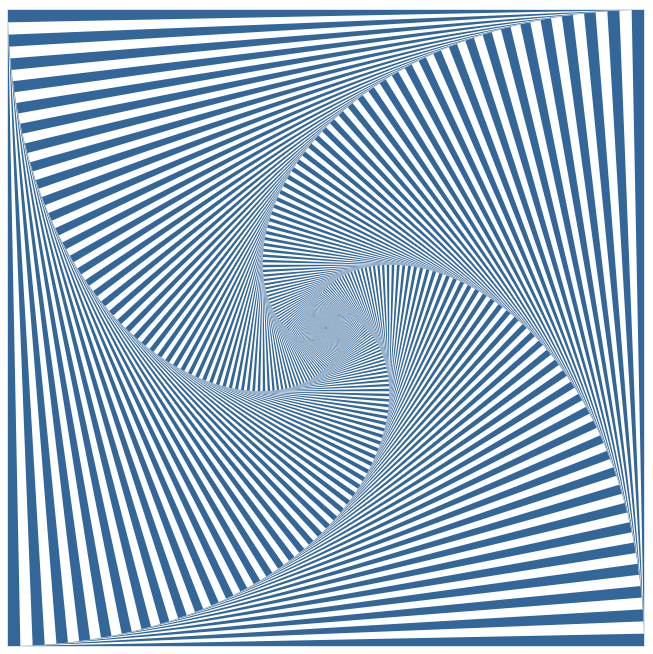
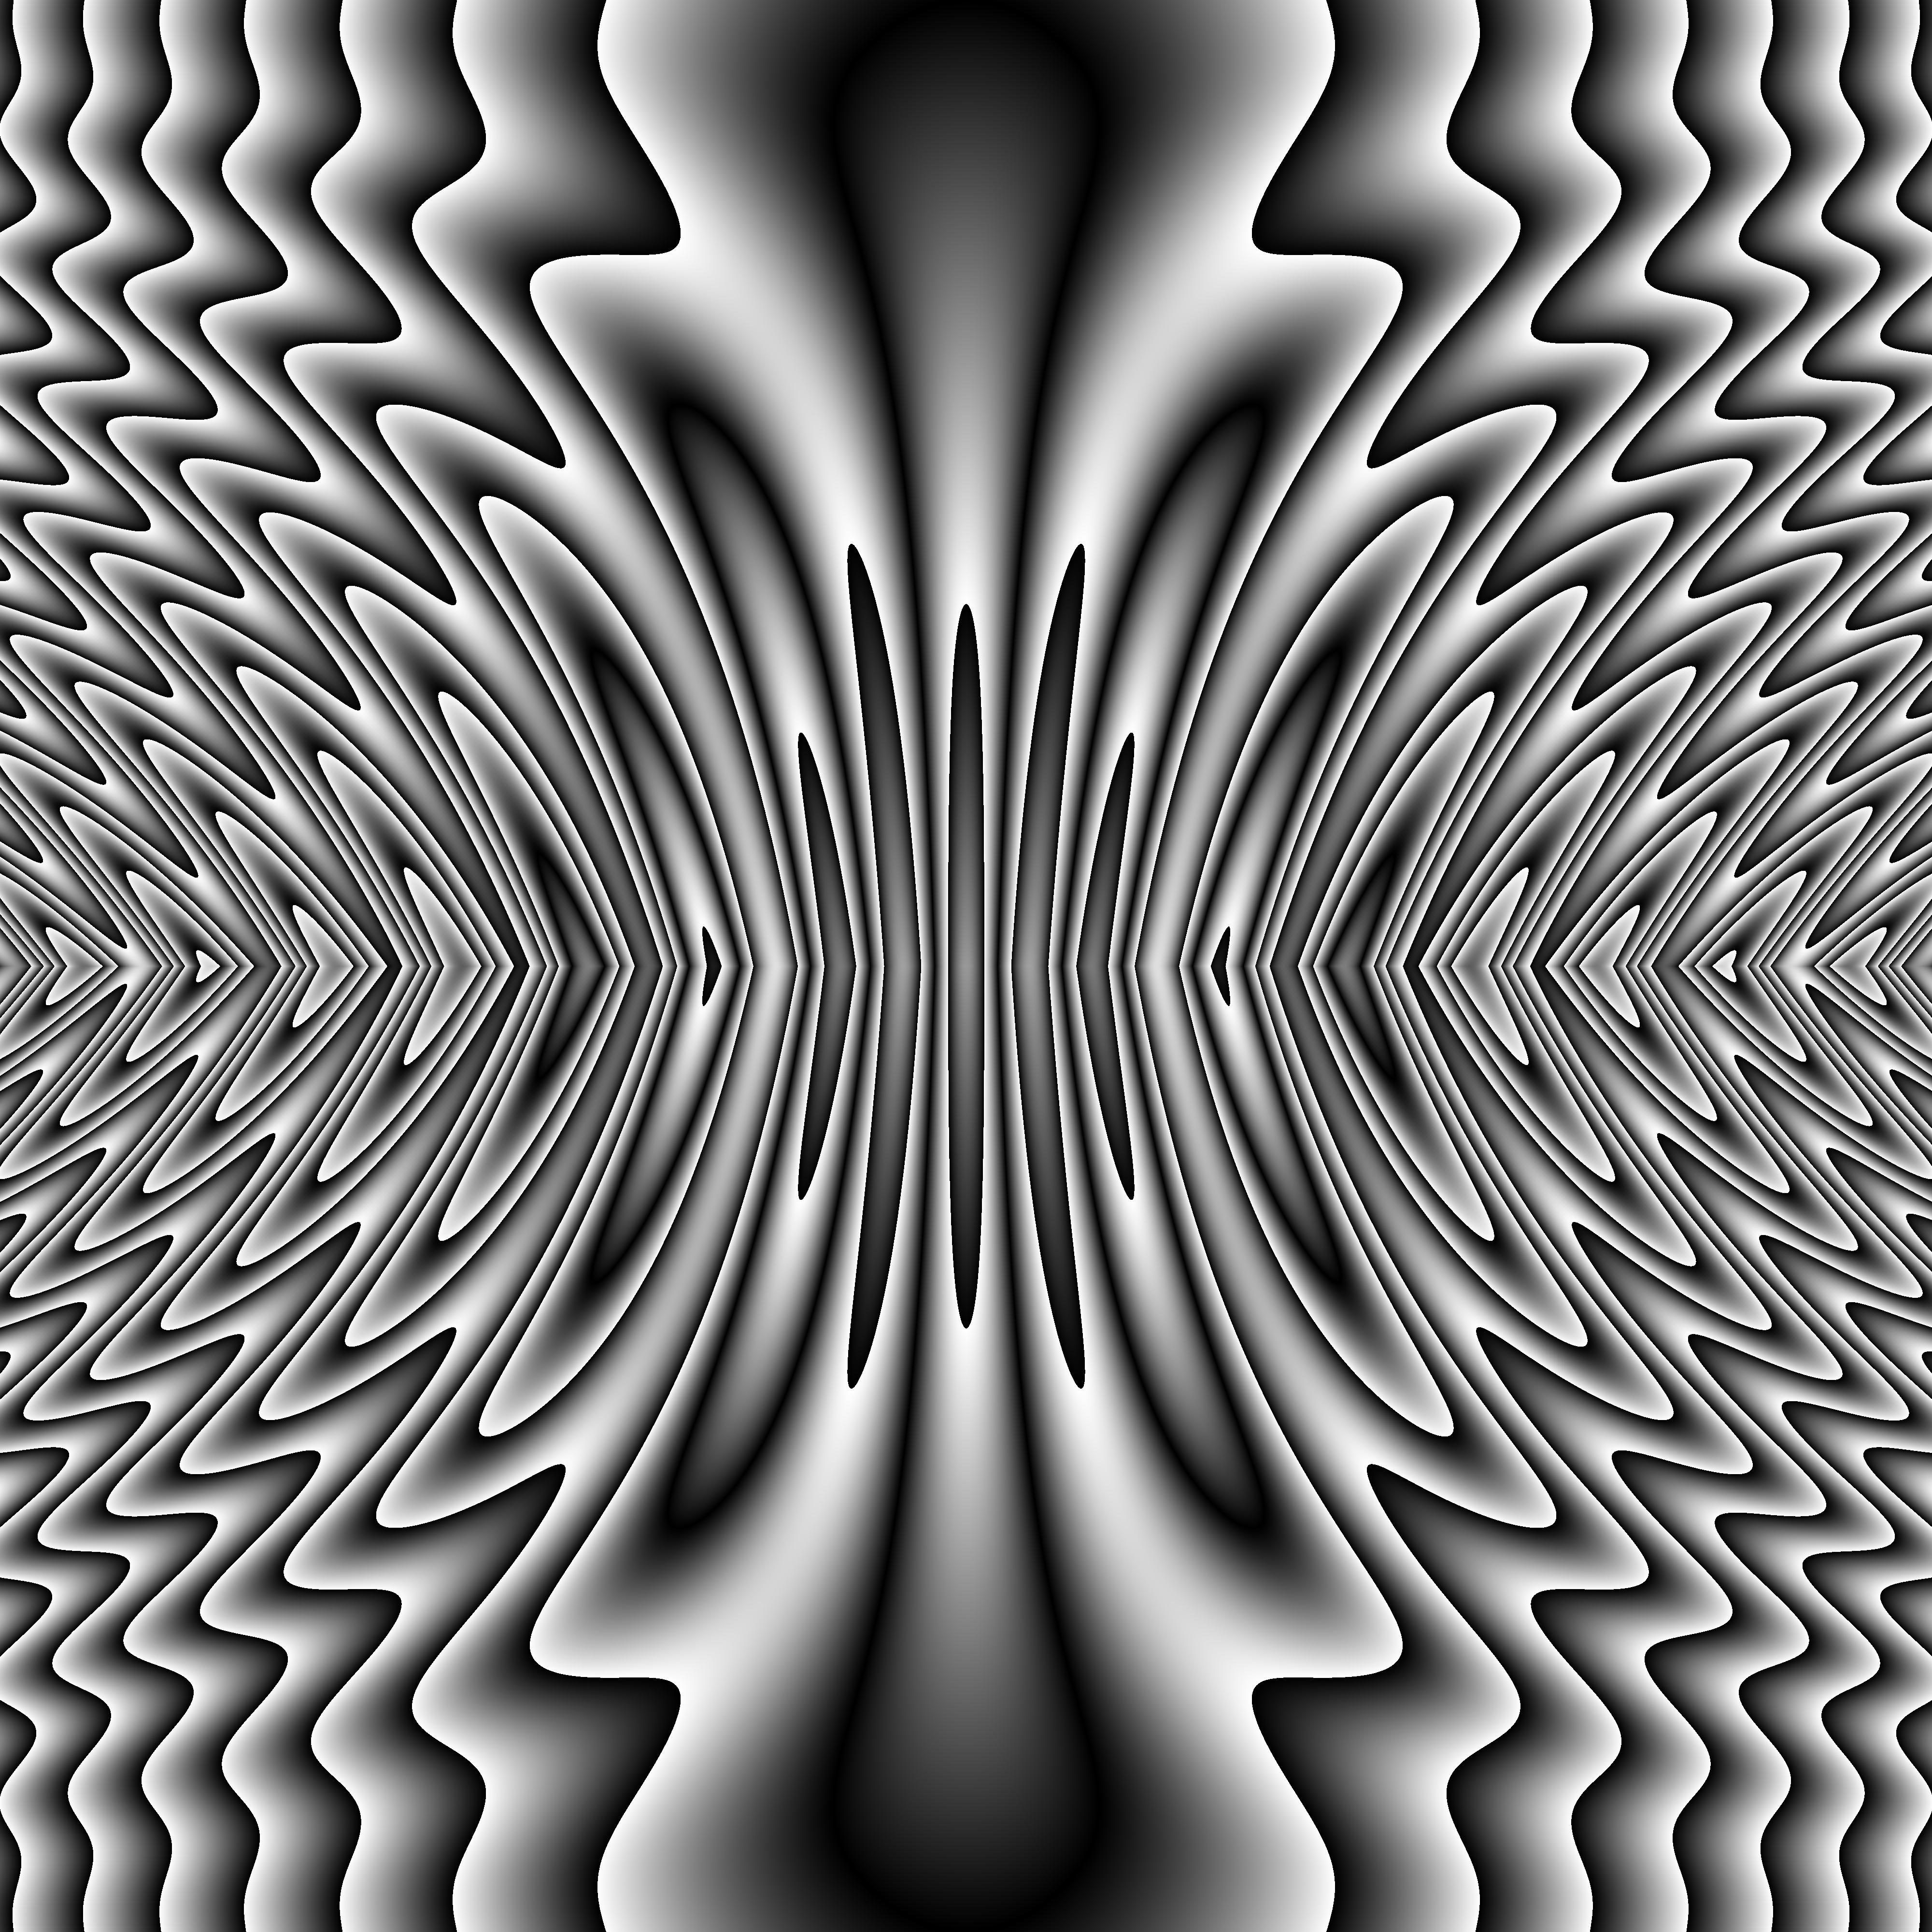
This student is using polar coordinates that she learned in PreCalculus class, trigonometry with radians, and has used a proprortion to work with the colors (the map command).  Later on the student uses the % operator, which calculates the remainder so that she can cycle through a set of drawing commands.

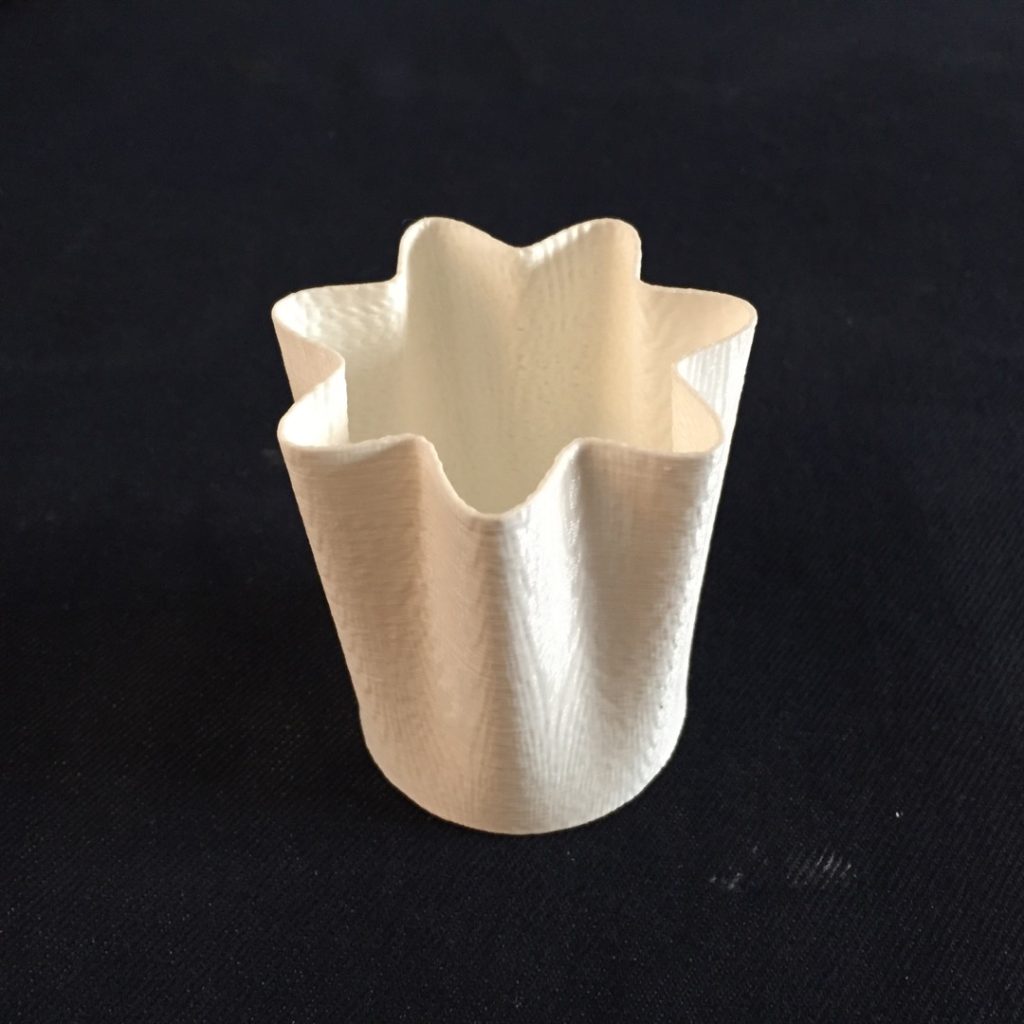
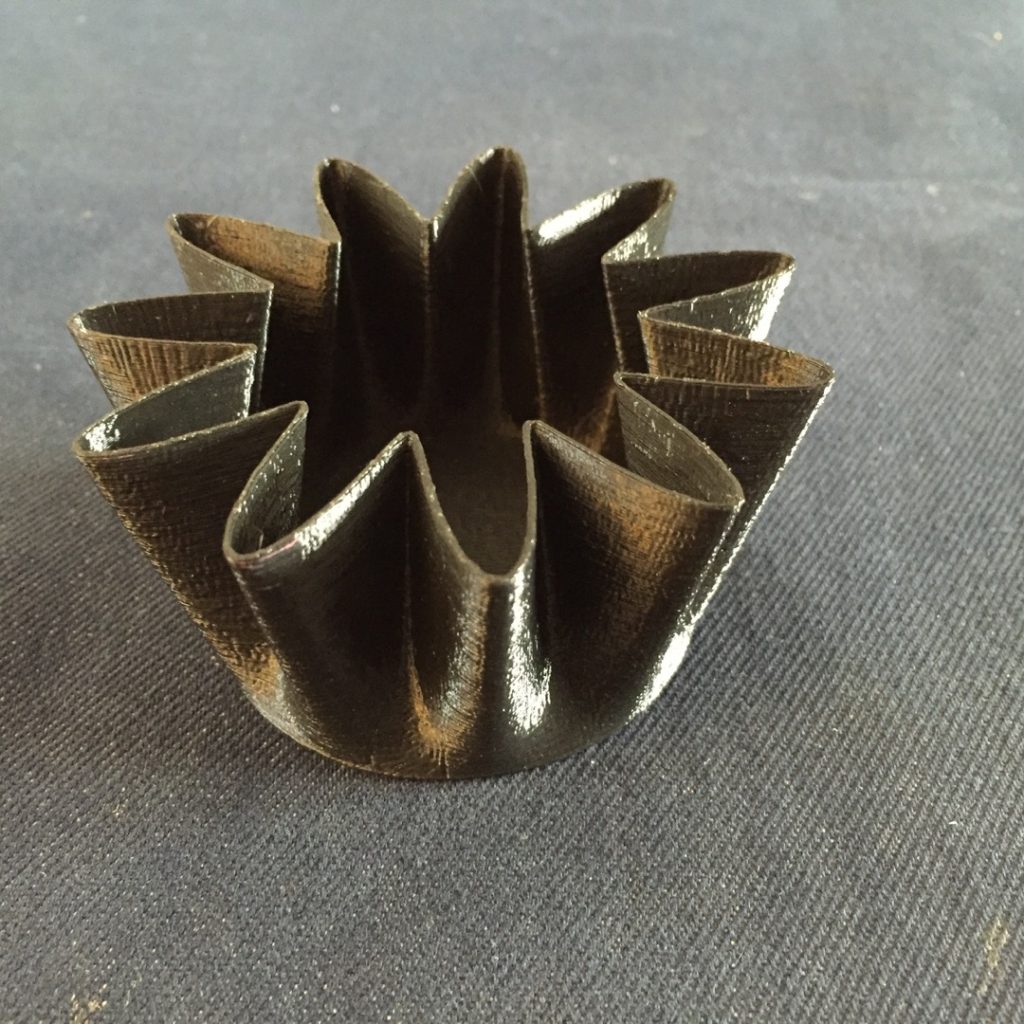
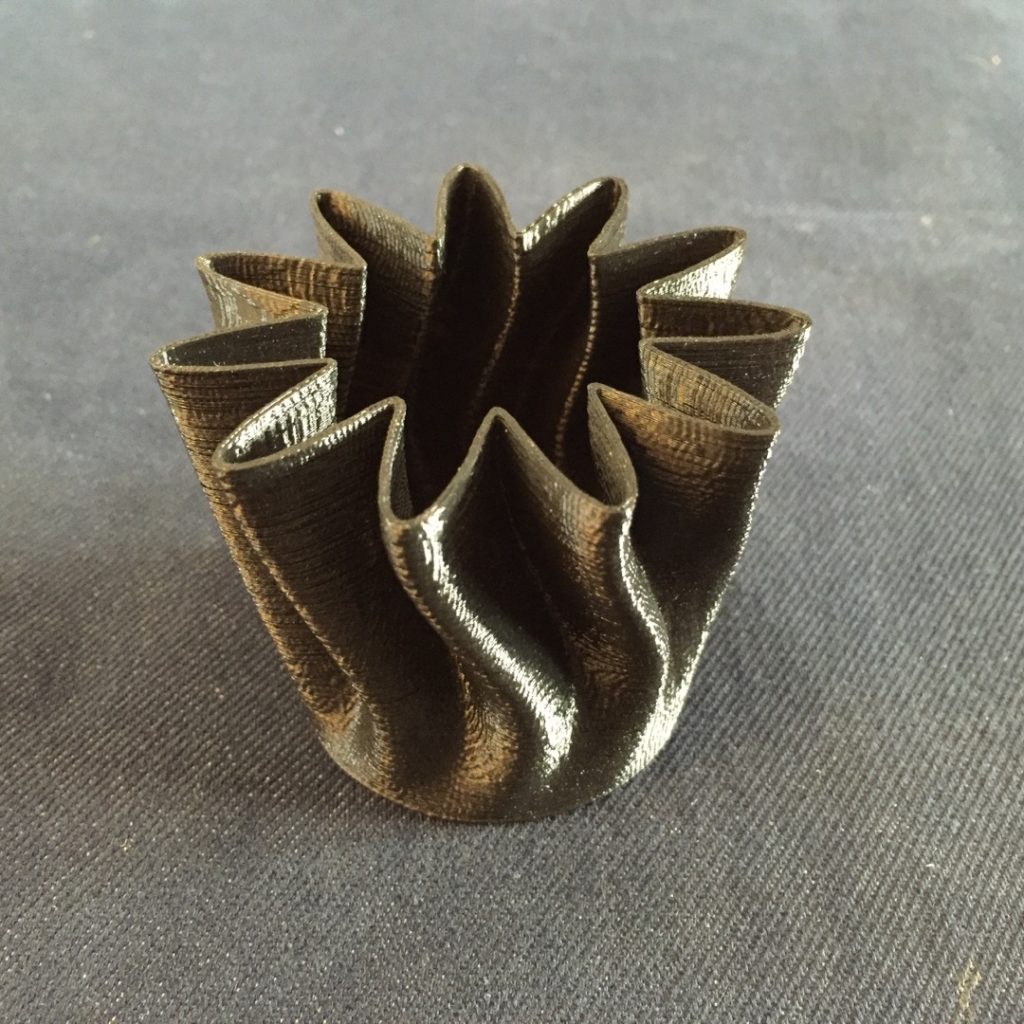
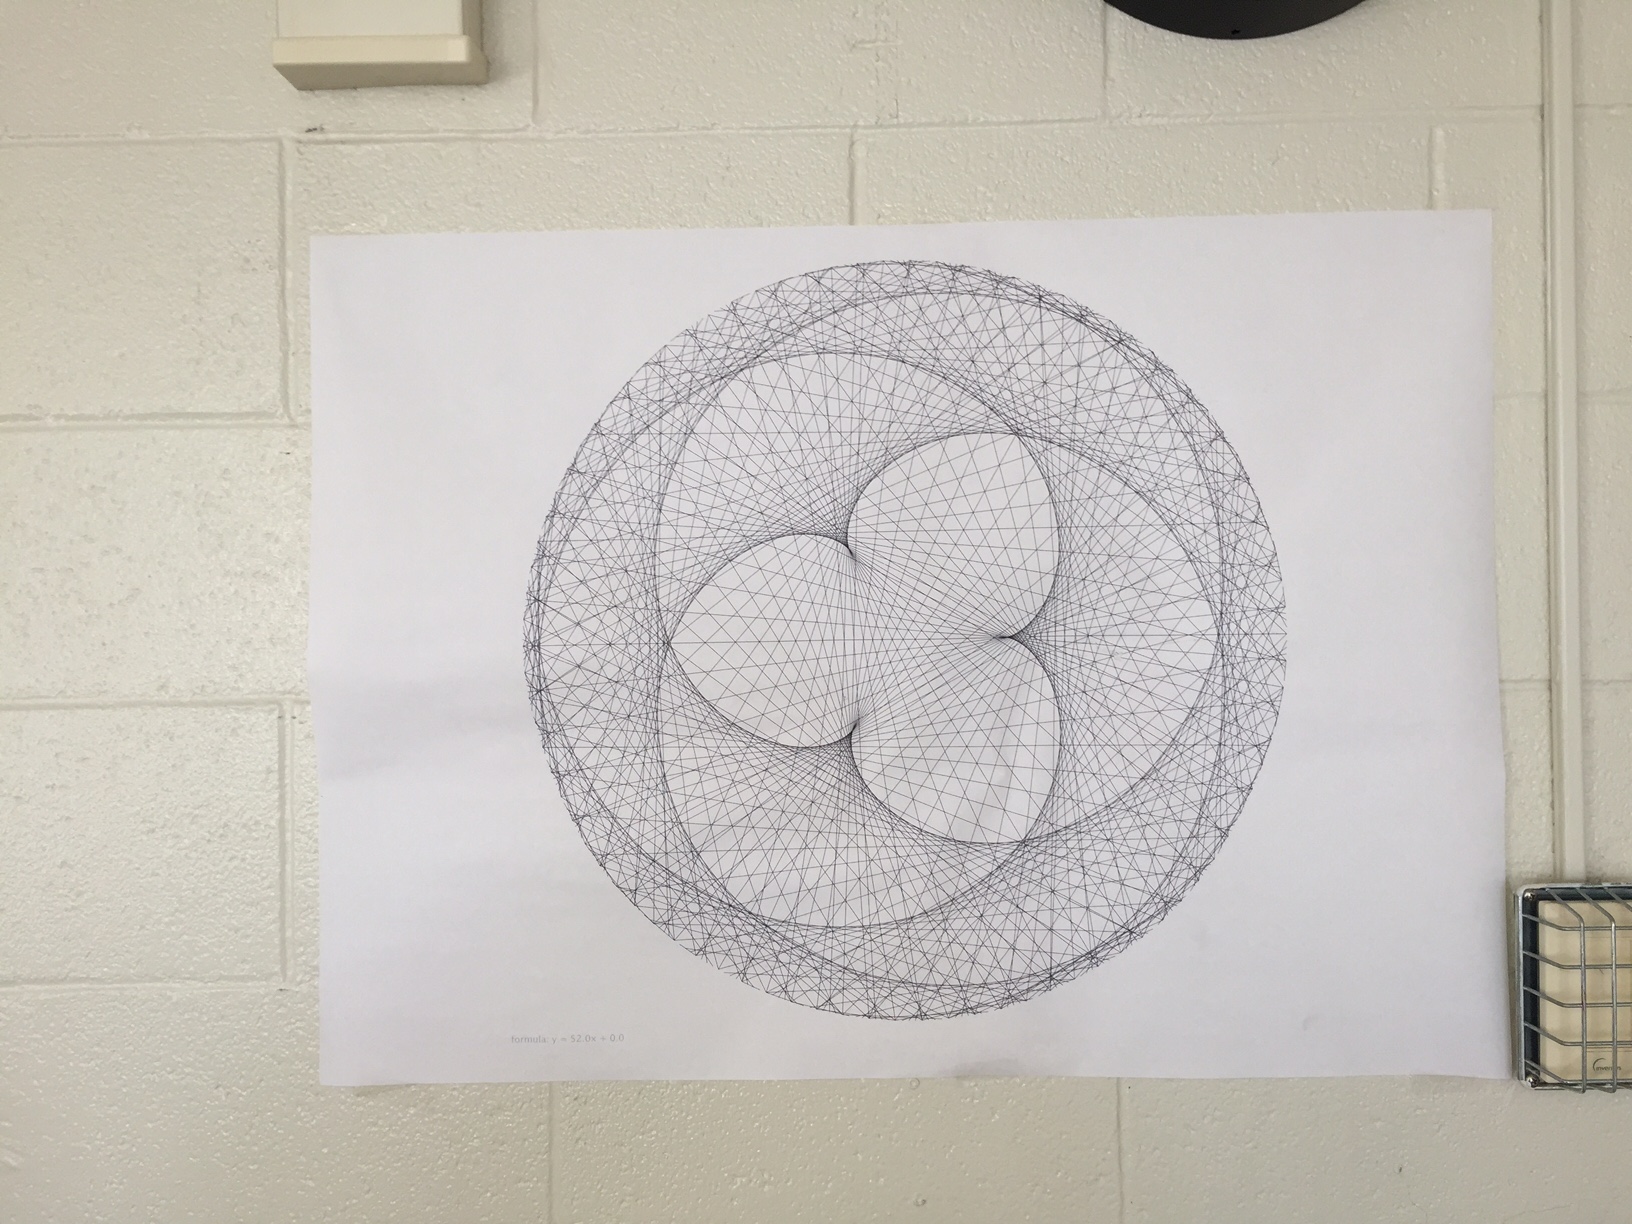
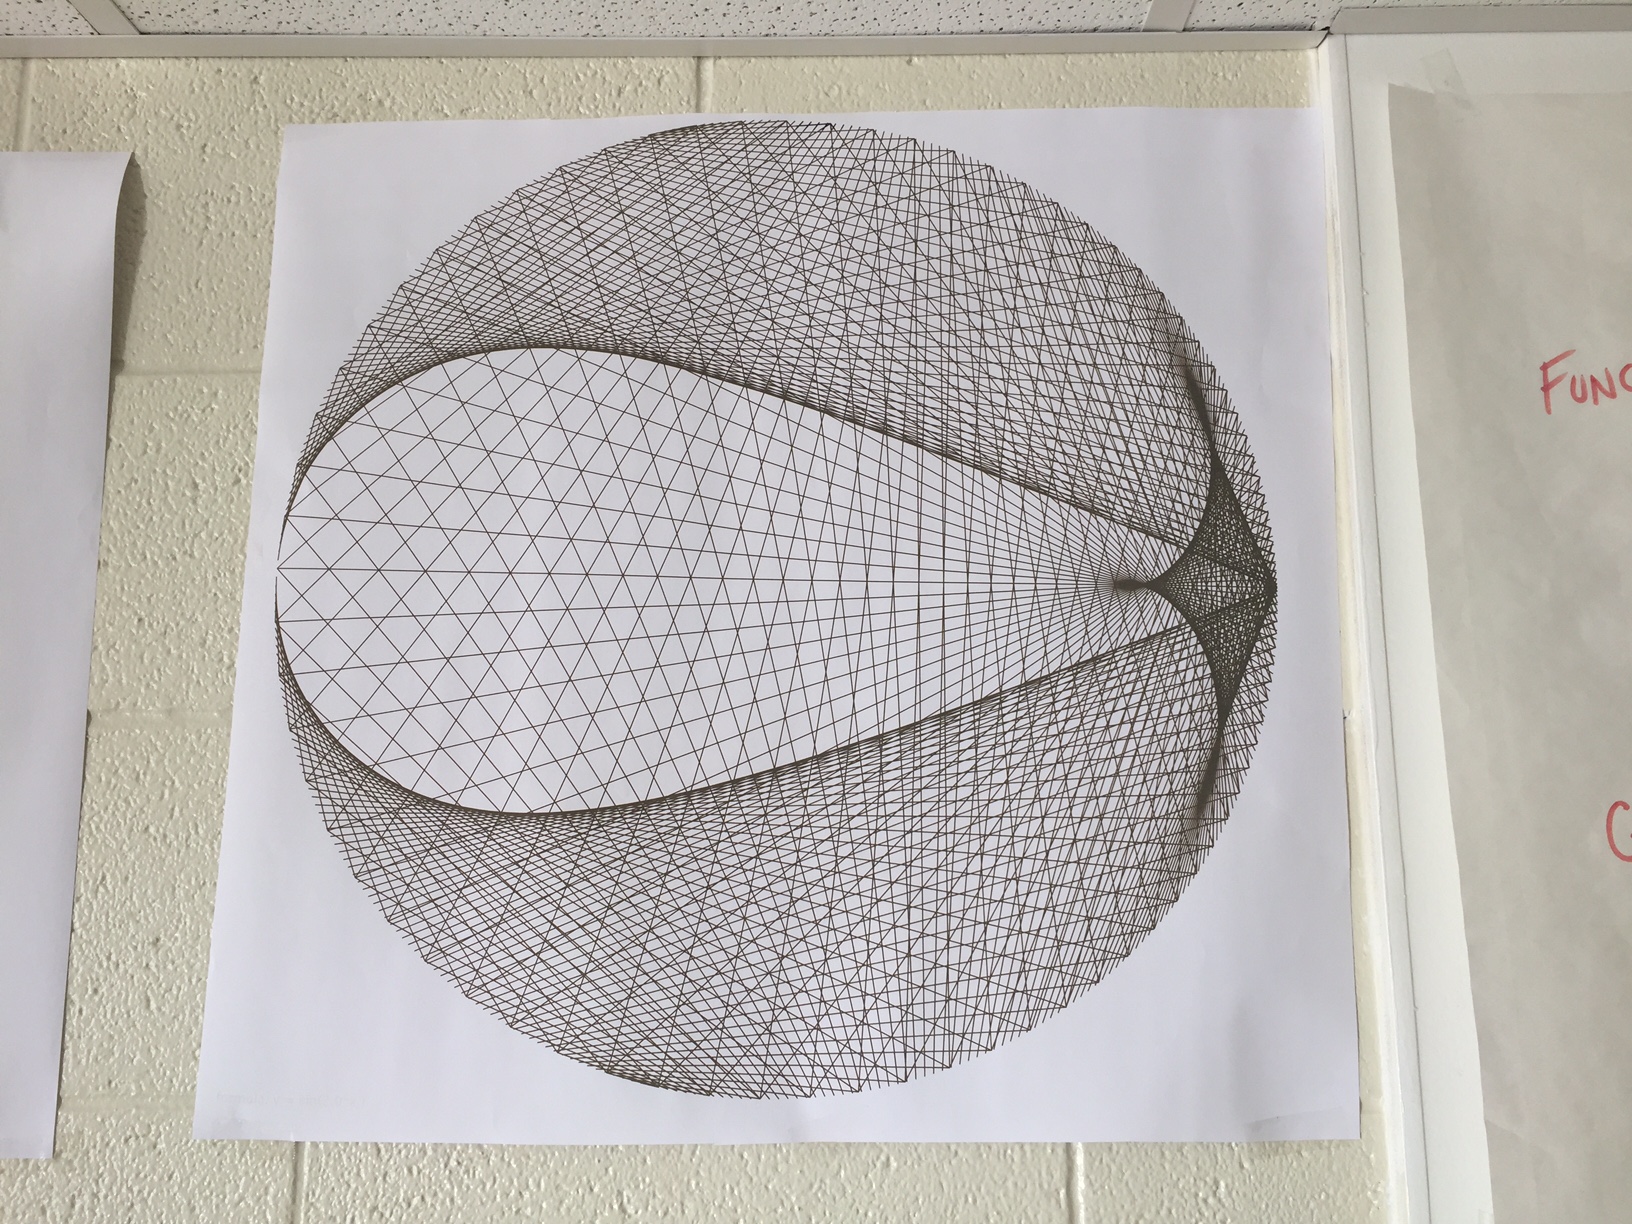
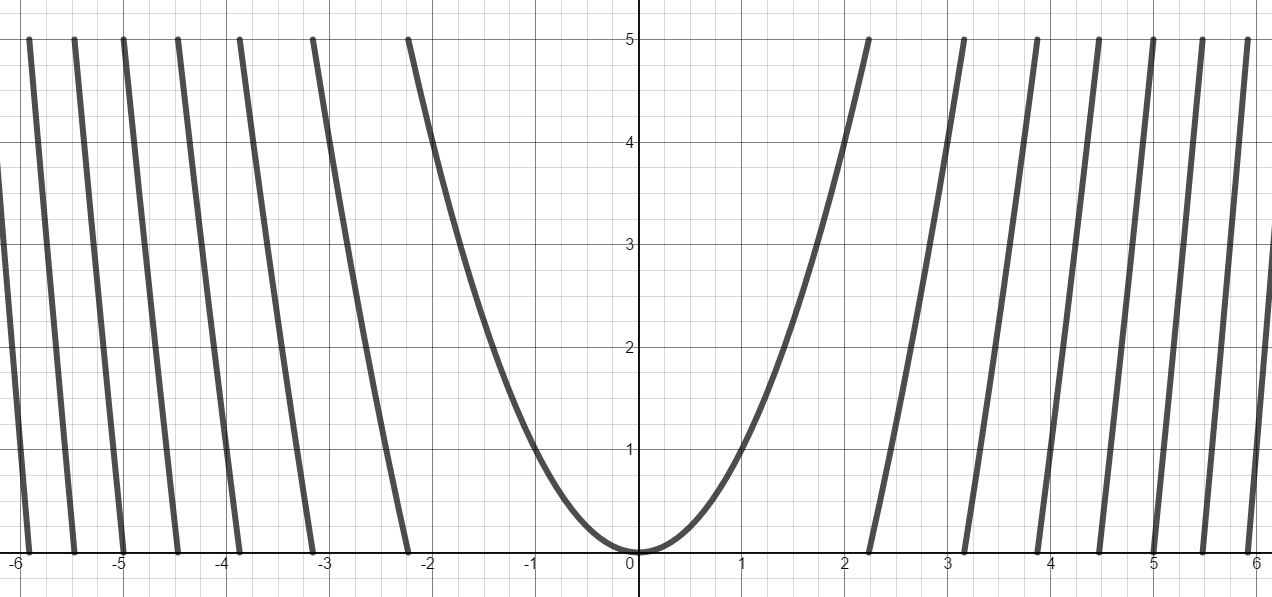
The picture on the right is from a student who was going to extend the Geometry from Scratch polygon angles from above. But the move and turn commands were too limited for him, so after a 5 minute talk, he learned how to use polar form of coordinates to easily make a n-gon from a given center. Keep in mind, that this student hadn’t heard of polar coordinates before and mastered them to get these shapes. I’m excited to see how much knowledge he’ll bring to PreCalculus next year when polar coordinates are officially “taught” to him. Here’s his blog post for his project.

20160609_121151

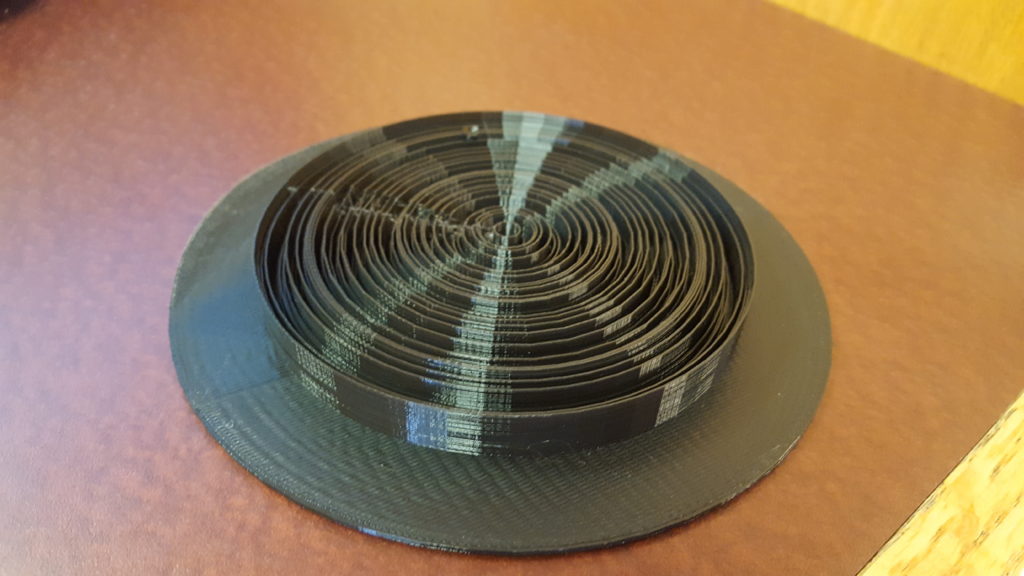
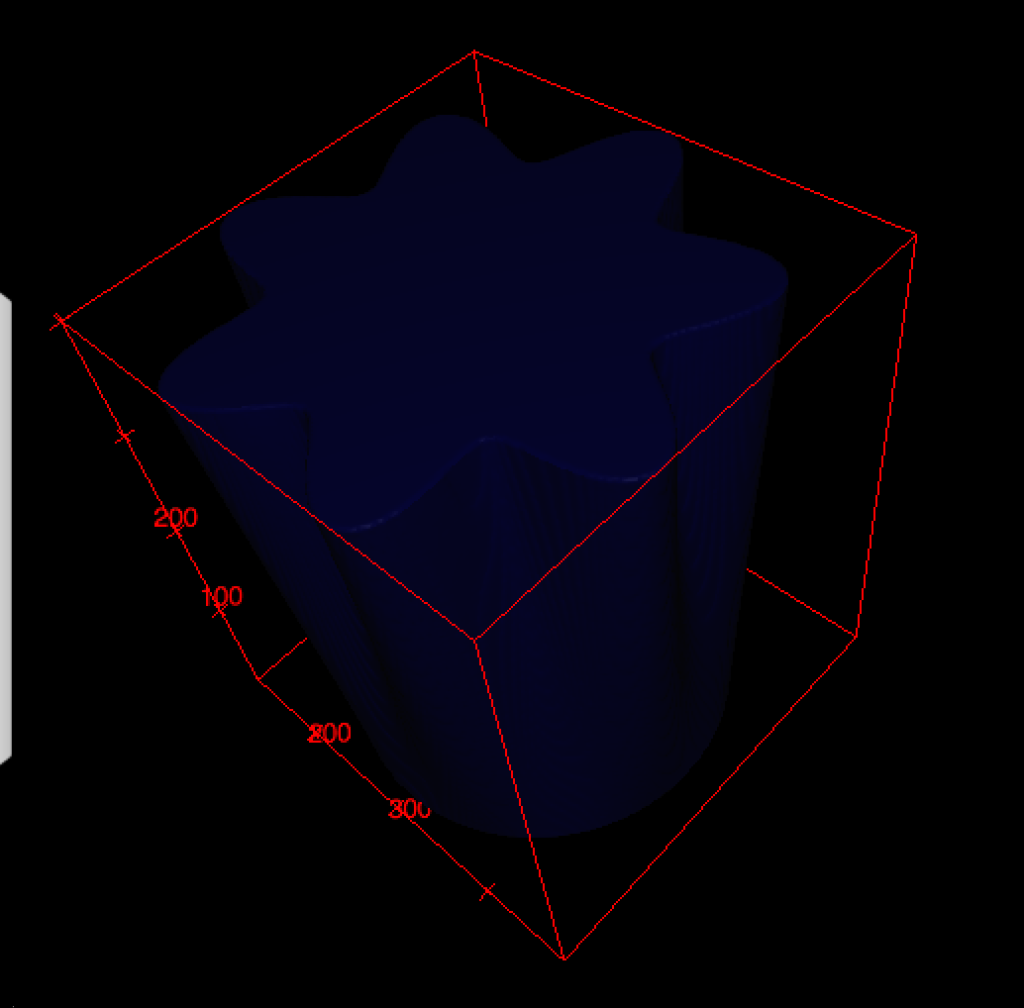
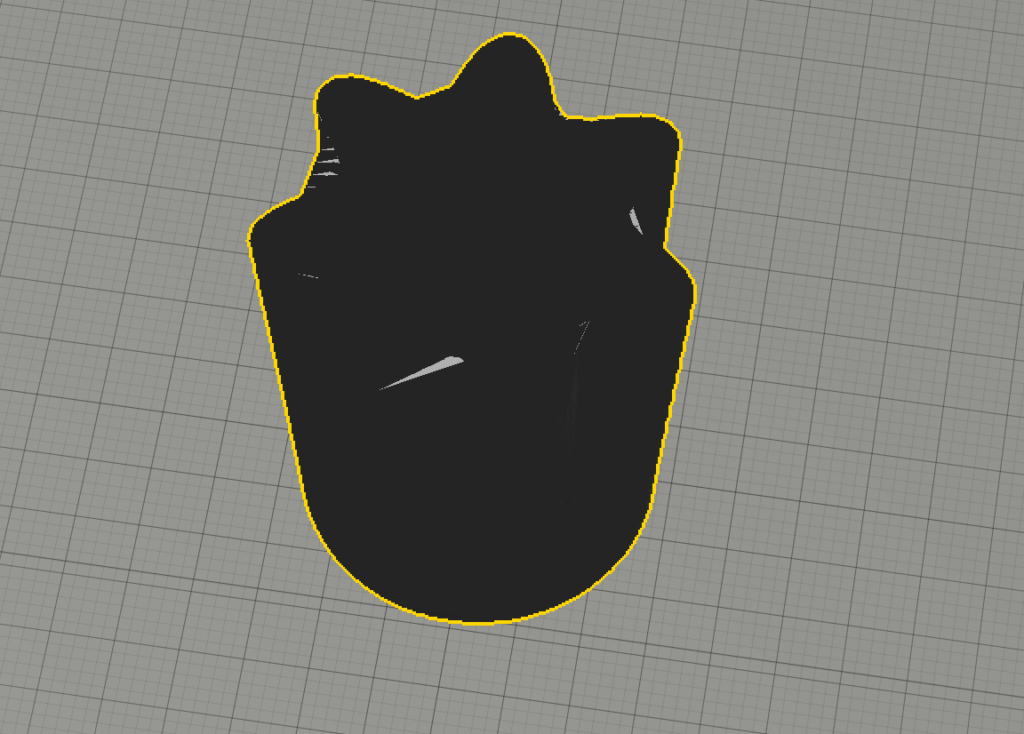
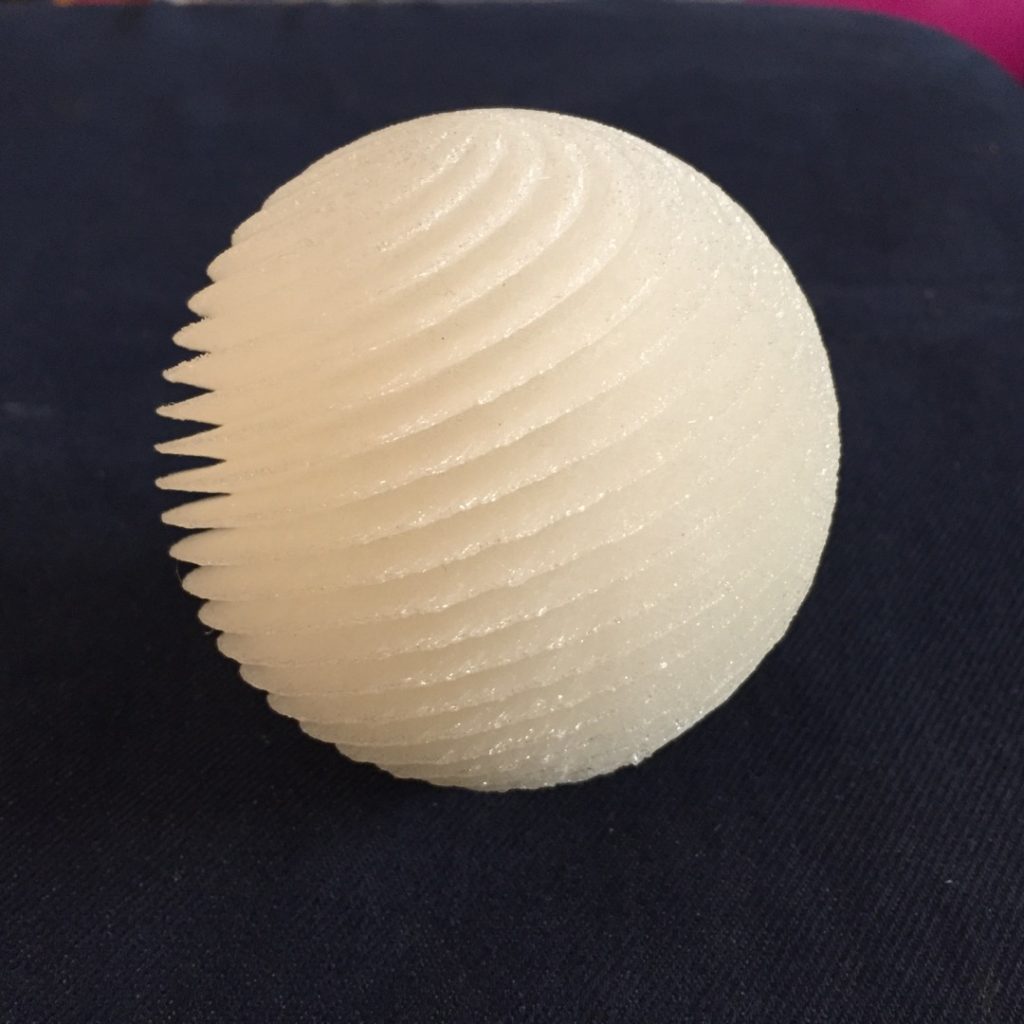
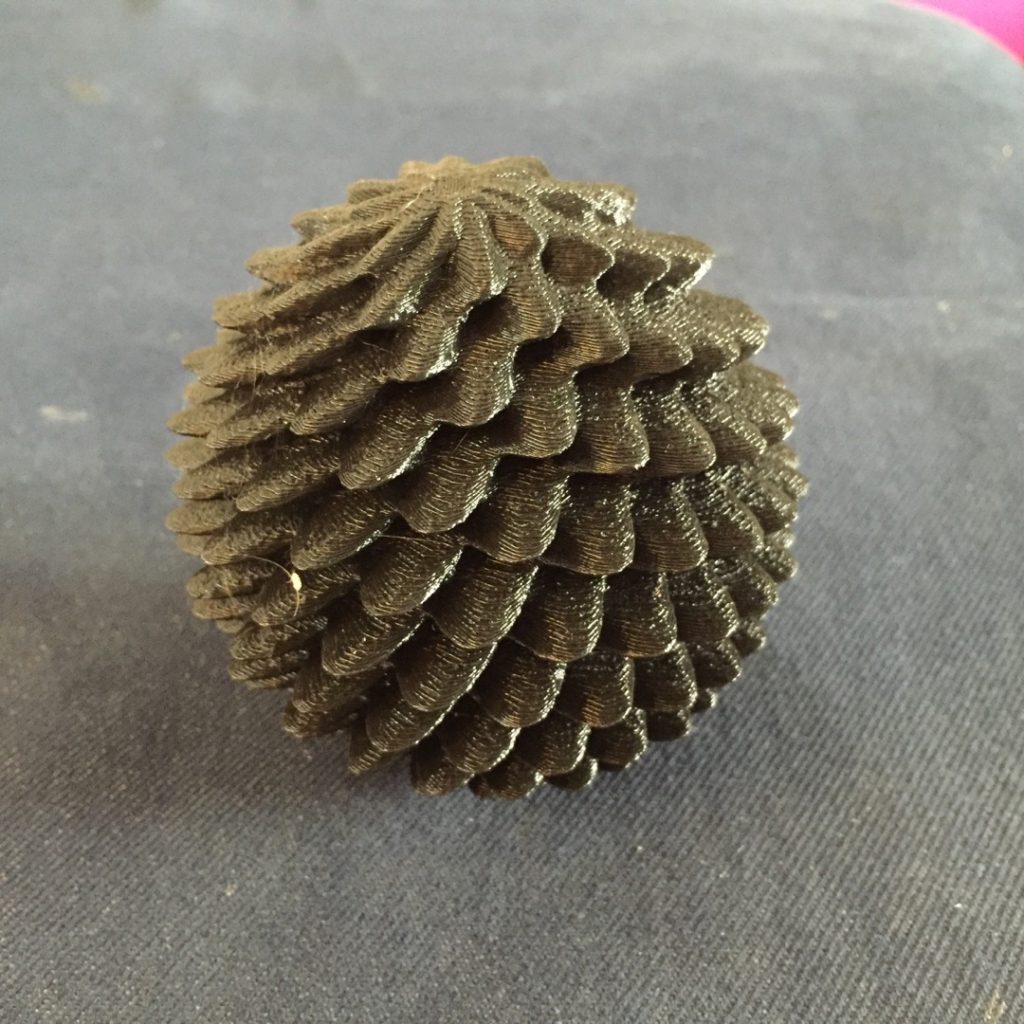
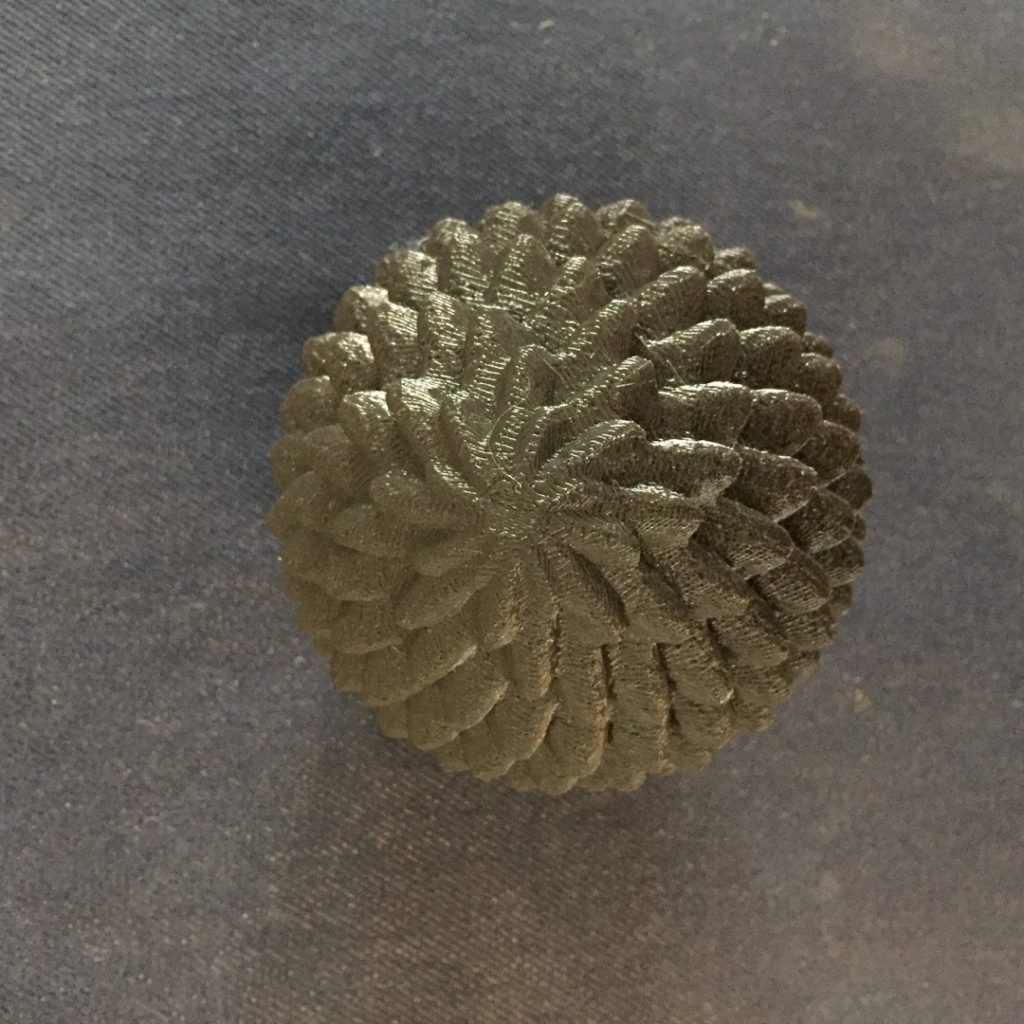
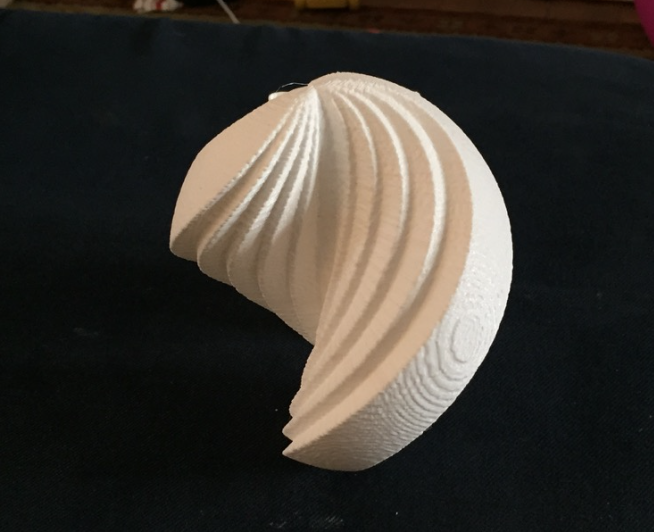
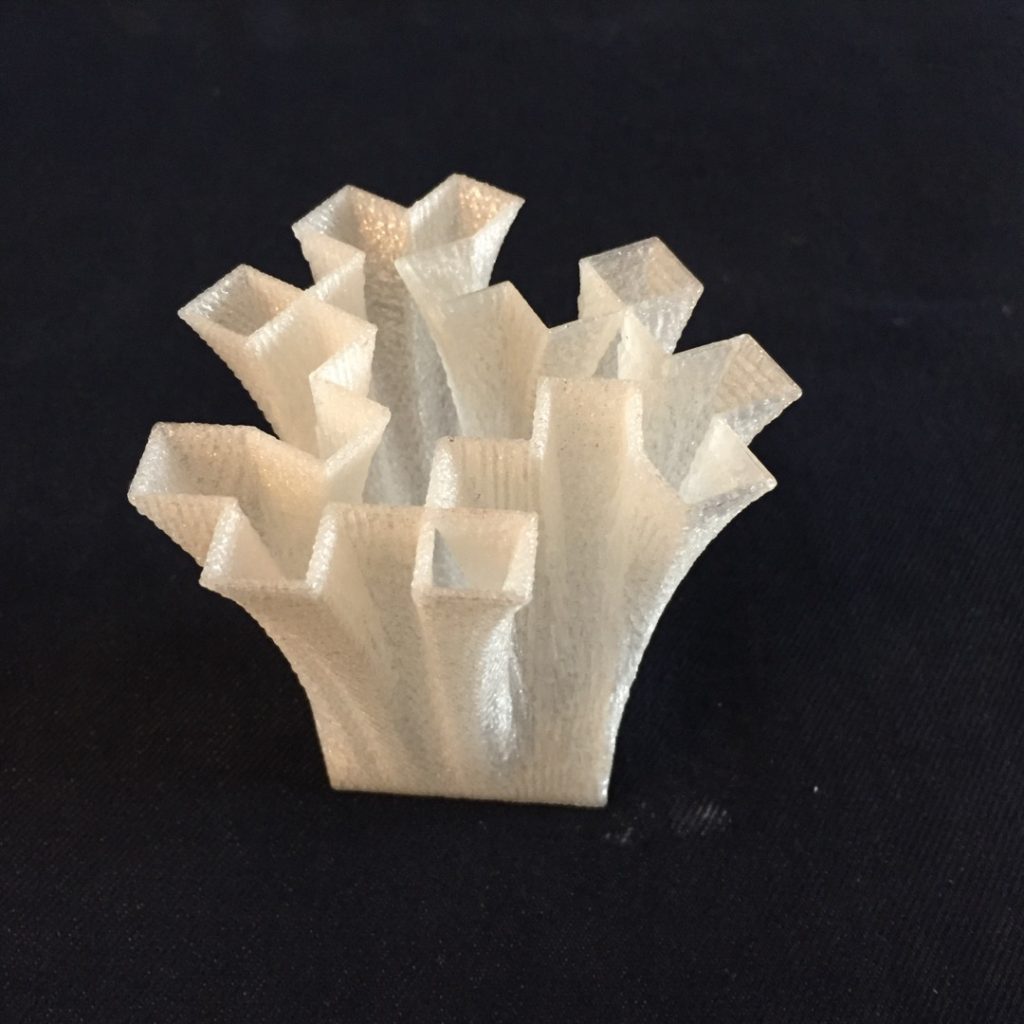
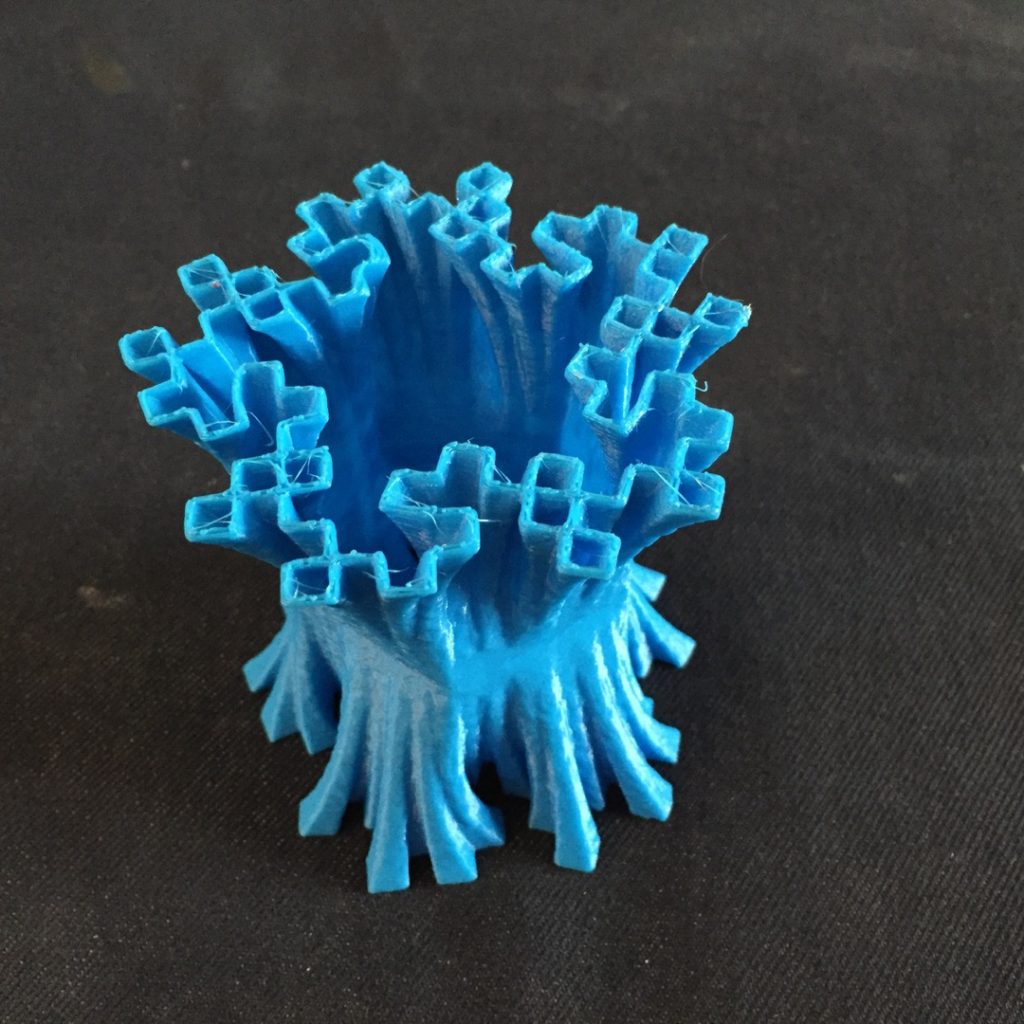
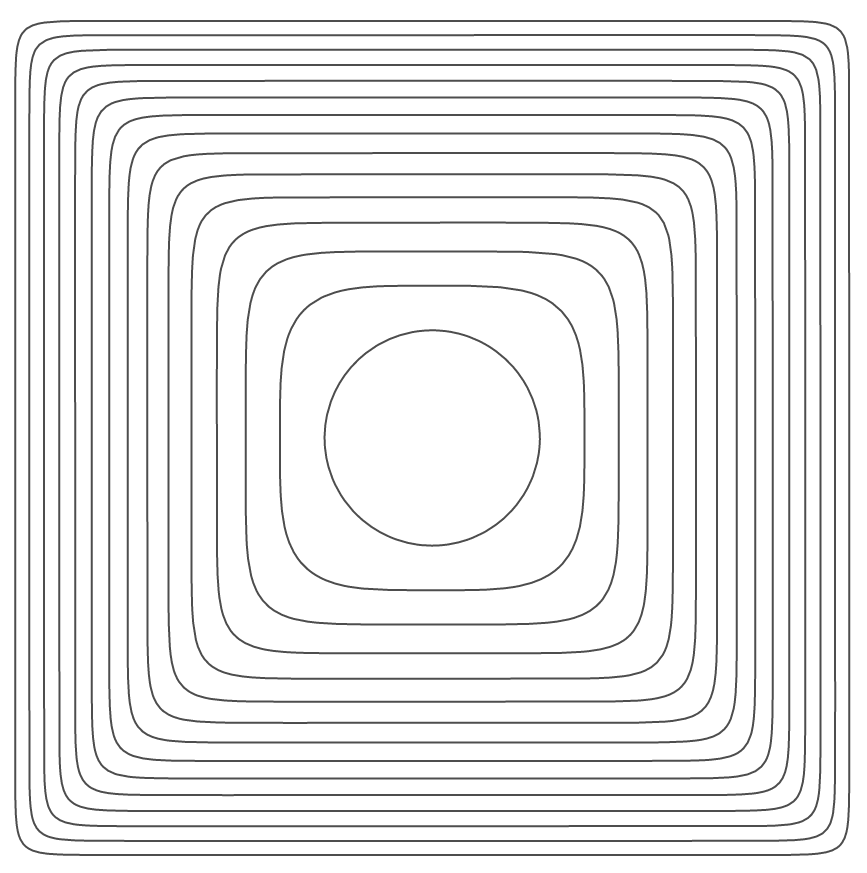
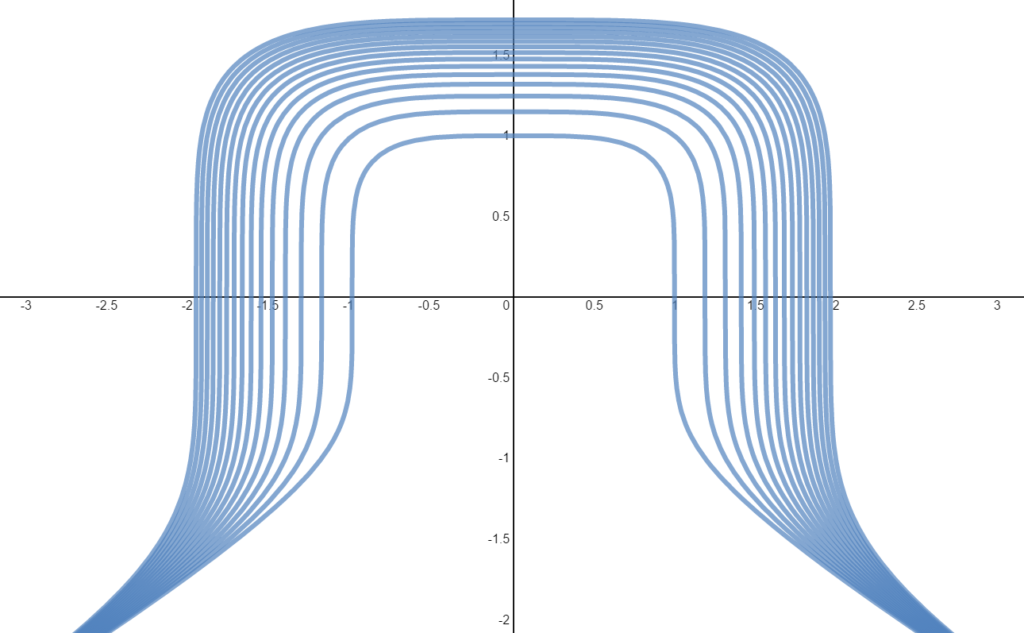
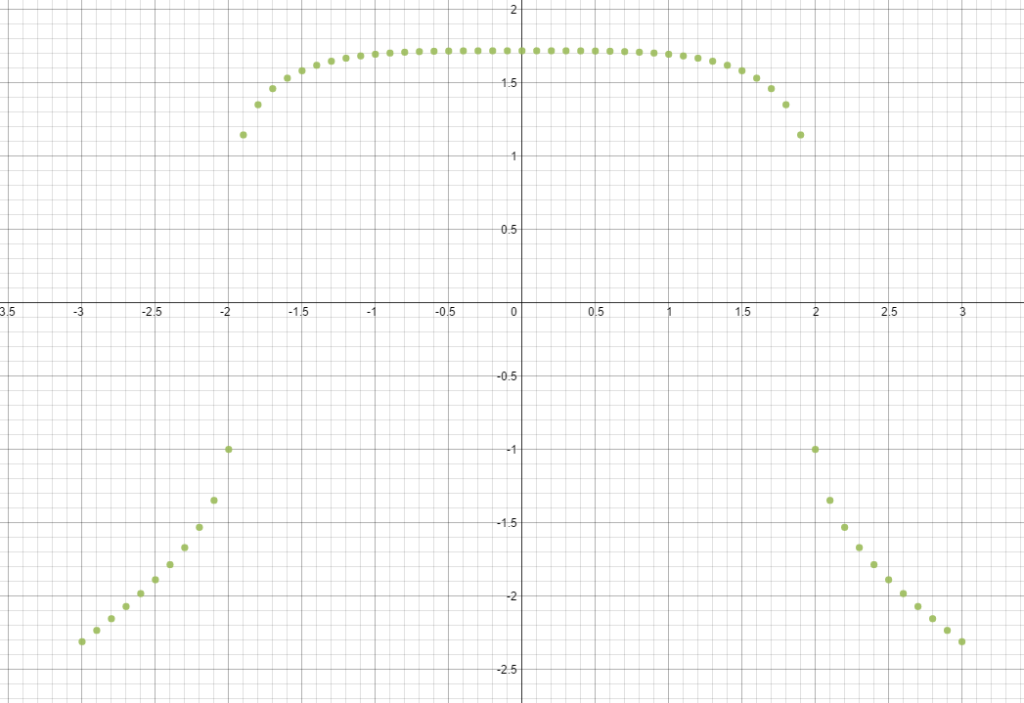
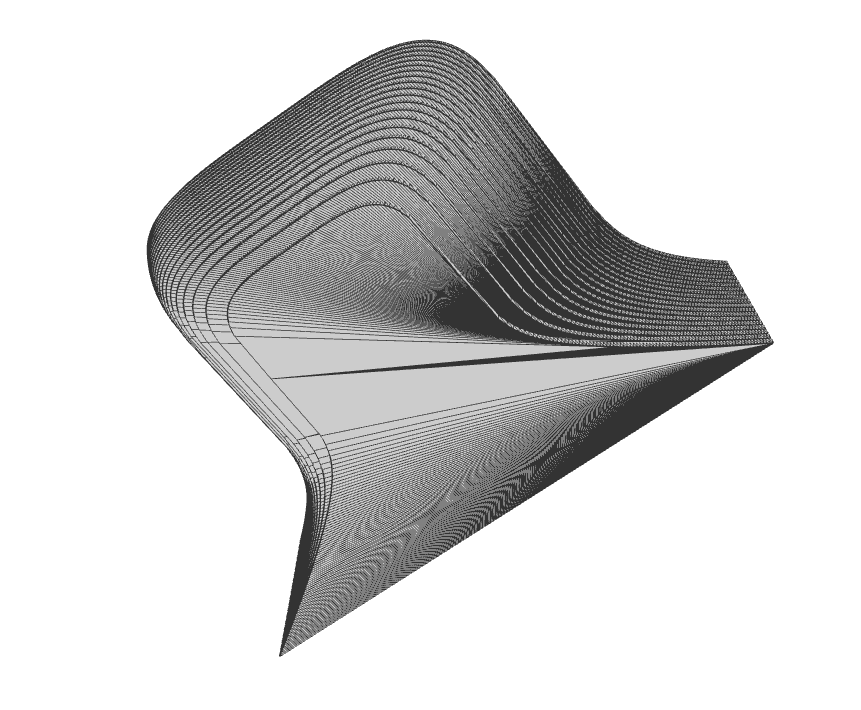
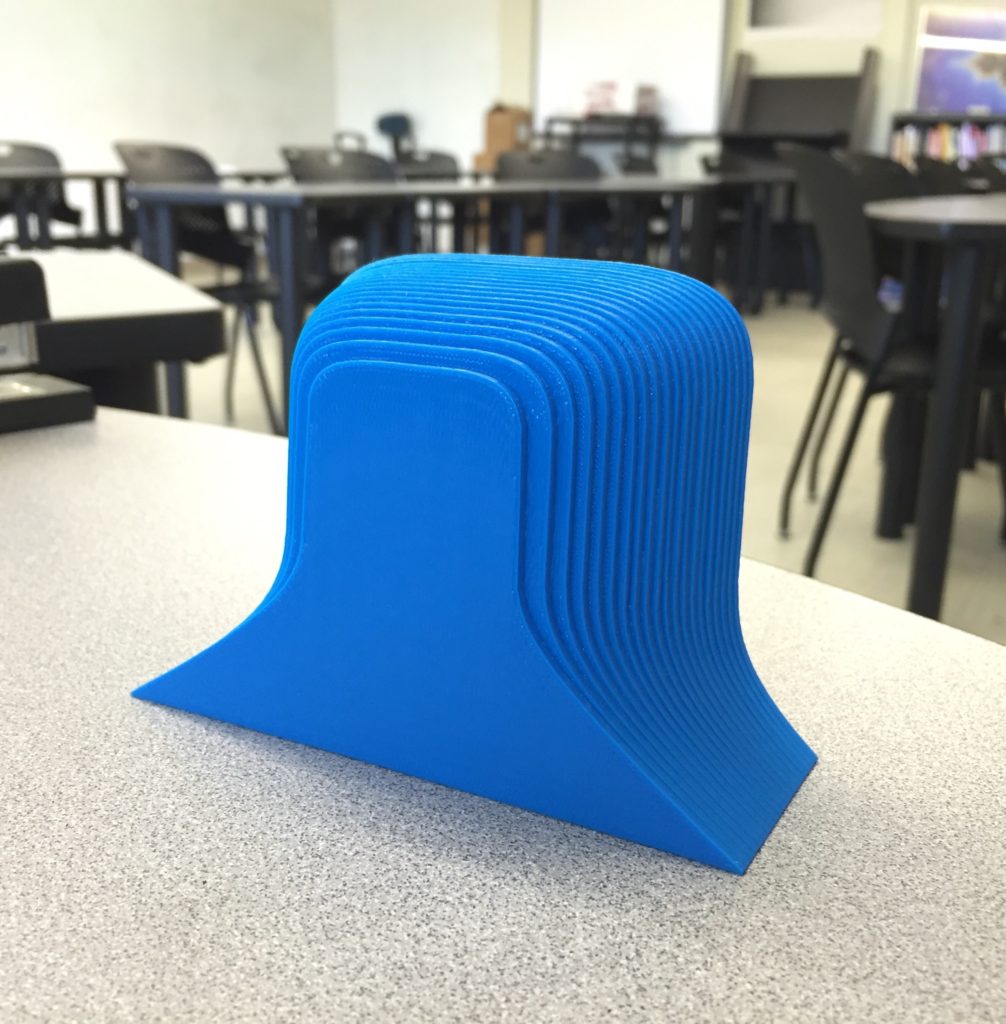
This student designed a 3d model with code to create this fantastic piece of math art. It is a series of cocentric circles that represents the digits of pi, the center of the circle has a small circle with height 3. The next circle has height 1, then 4, then 1, … Here’s his blog post with code samples. He used 3D polar coordinates as well, and he made many connections to his project and the integration unit of his calculus class (rotational volumes).

particledrawing

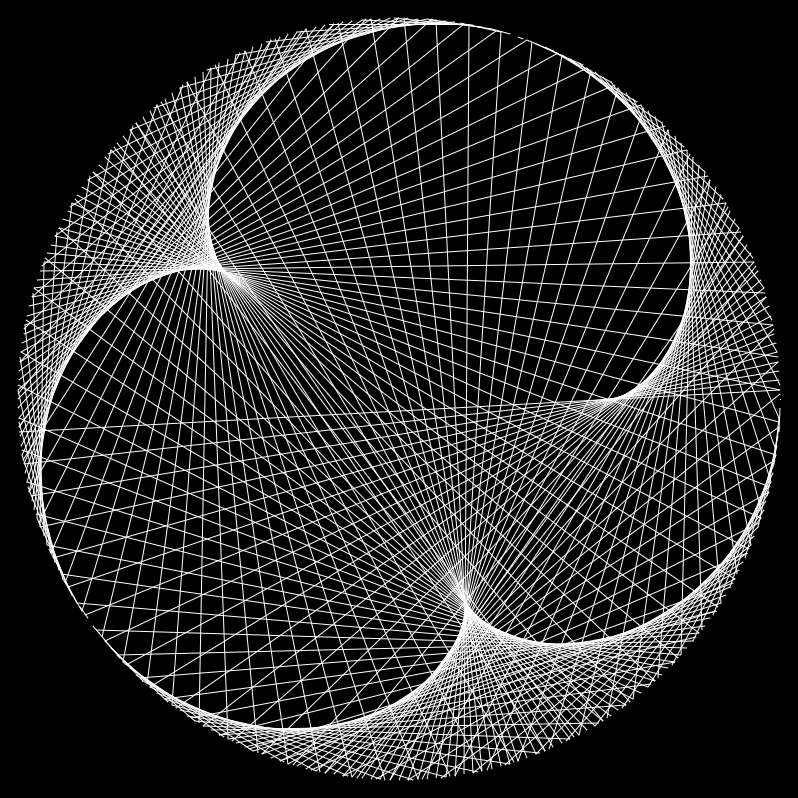
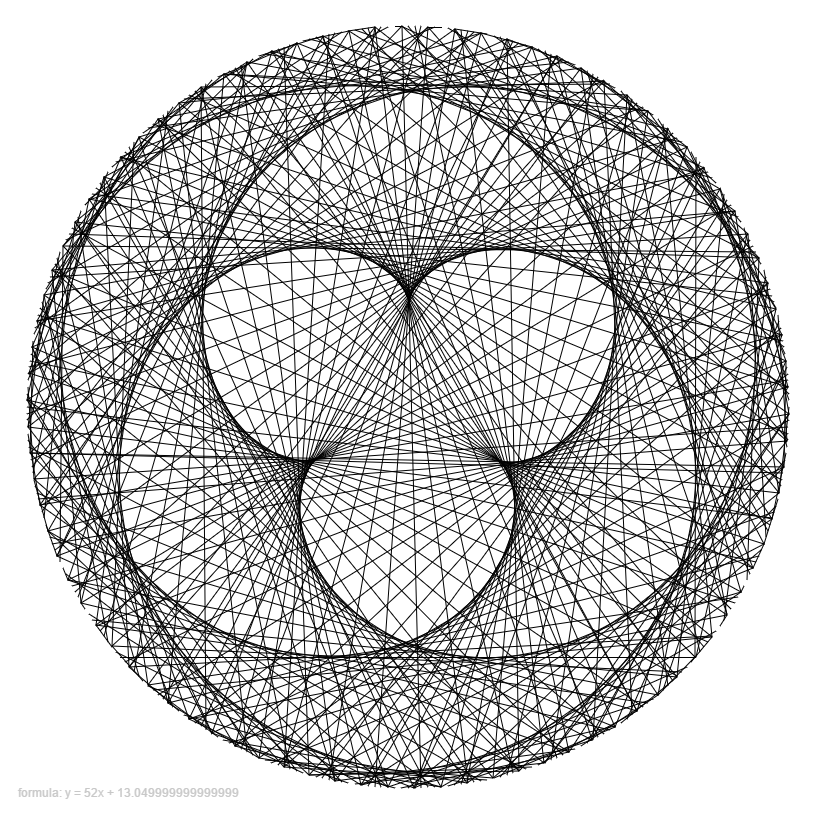
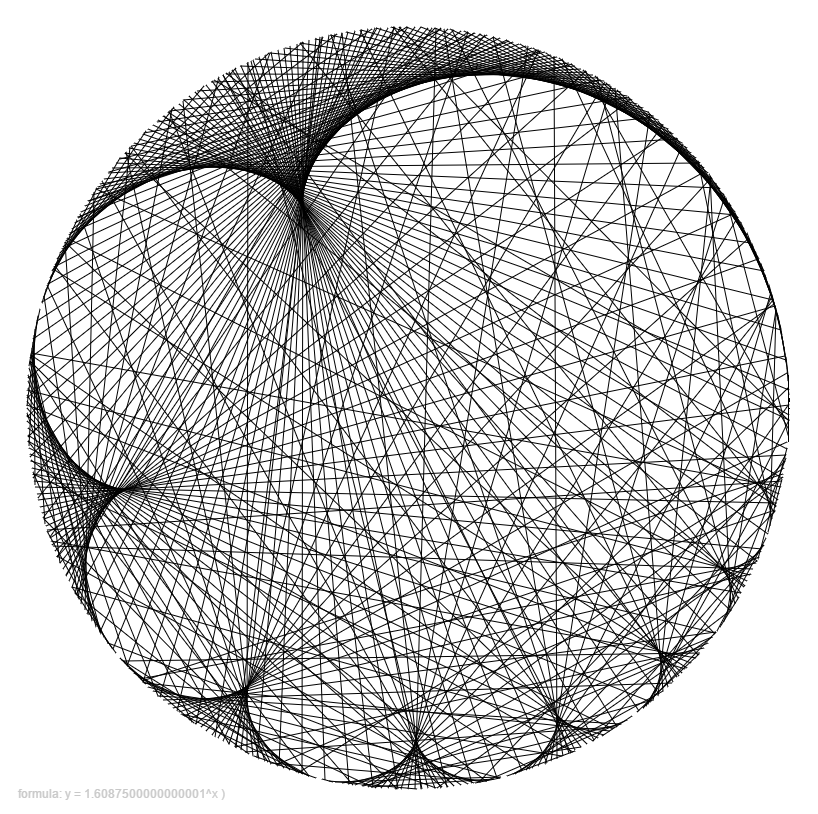
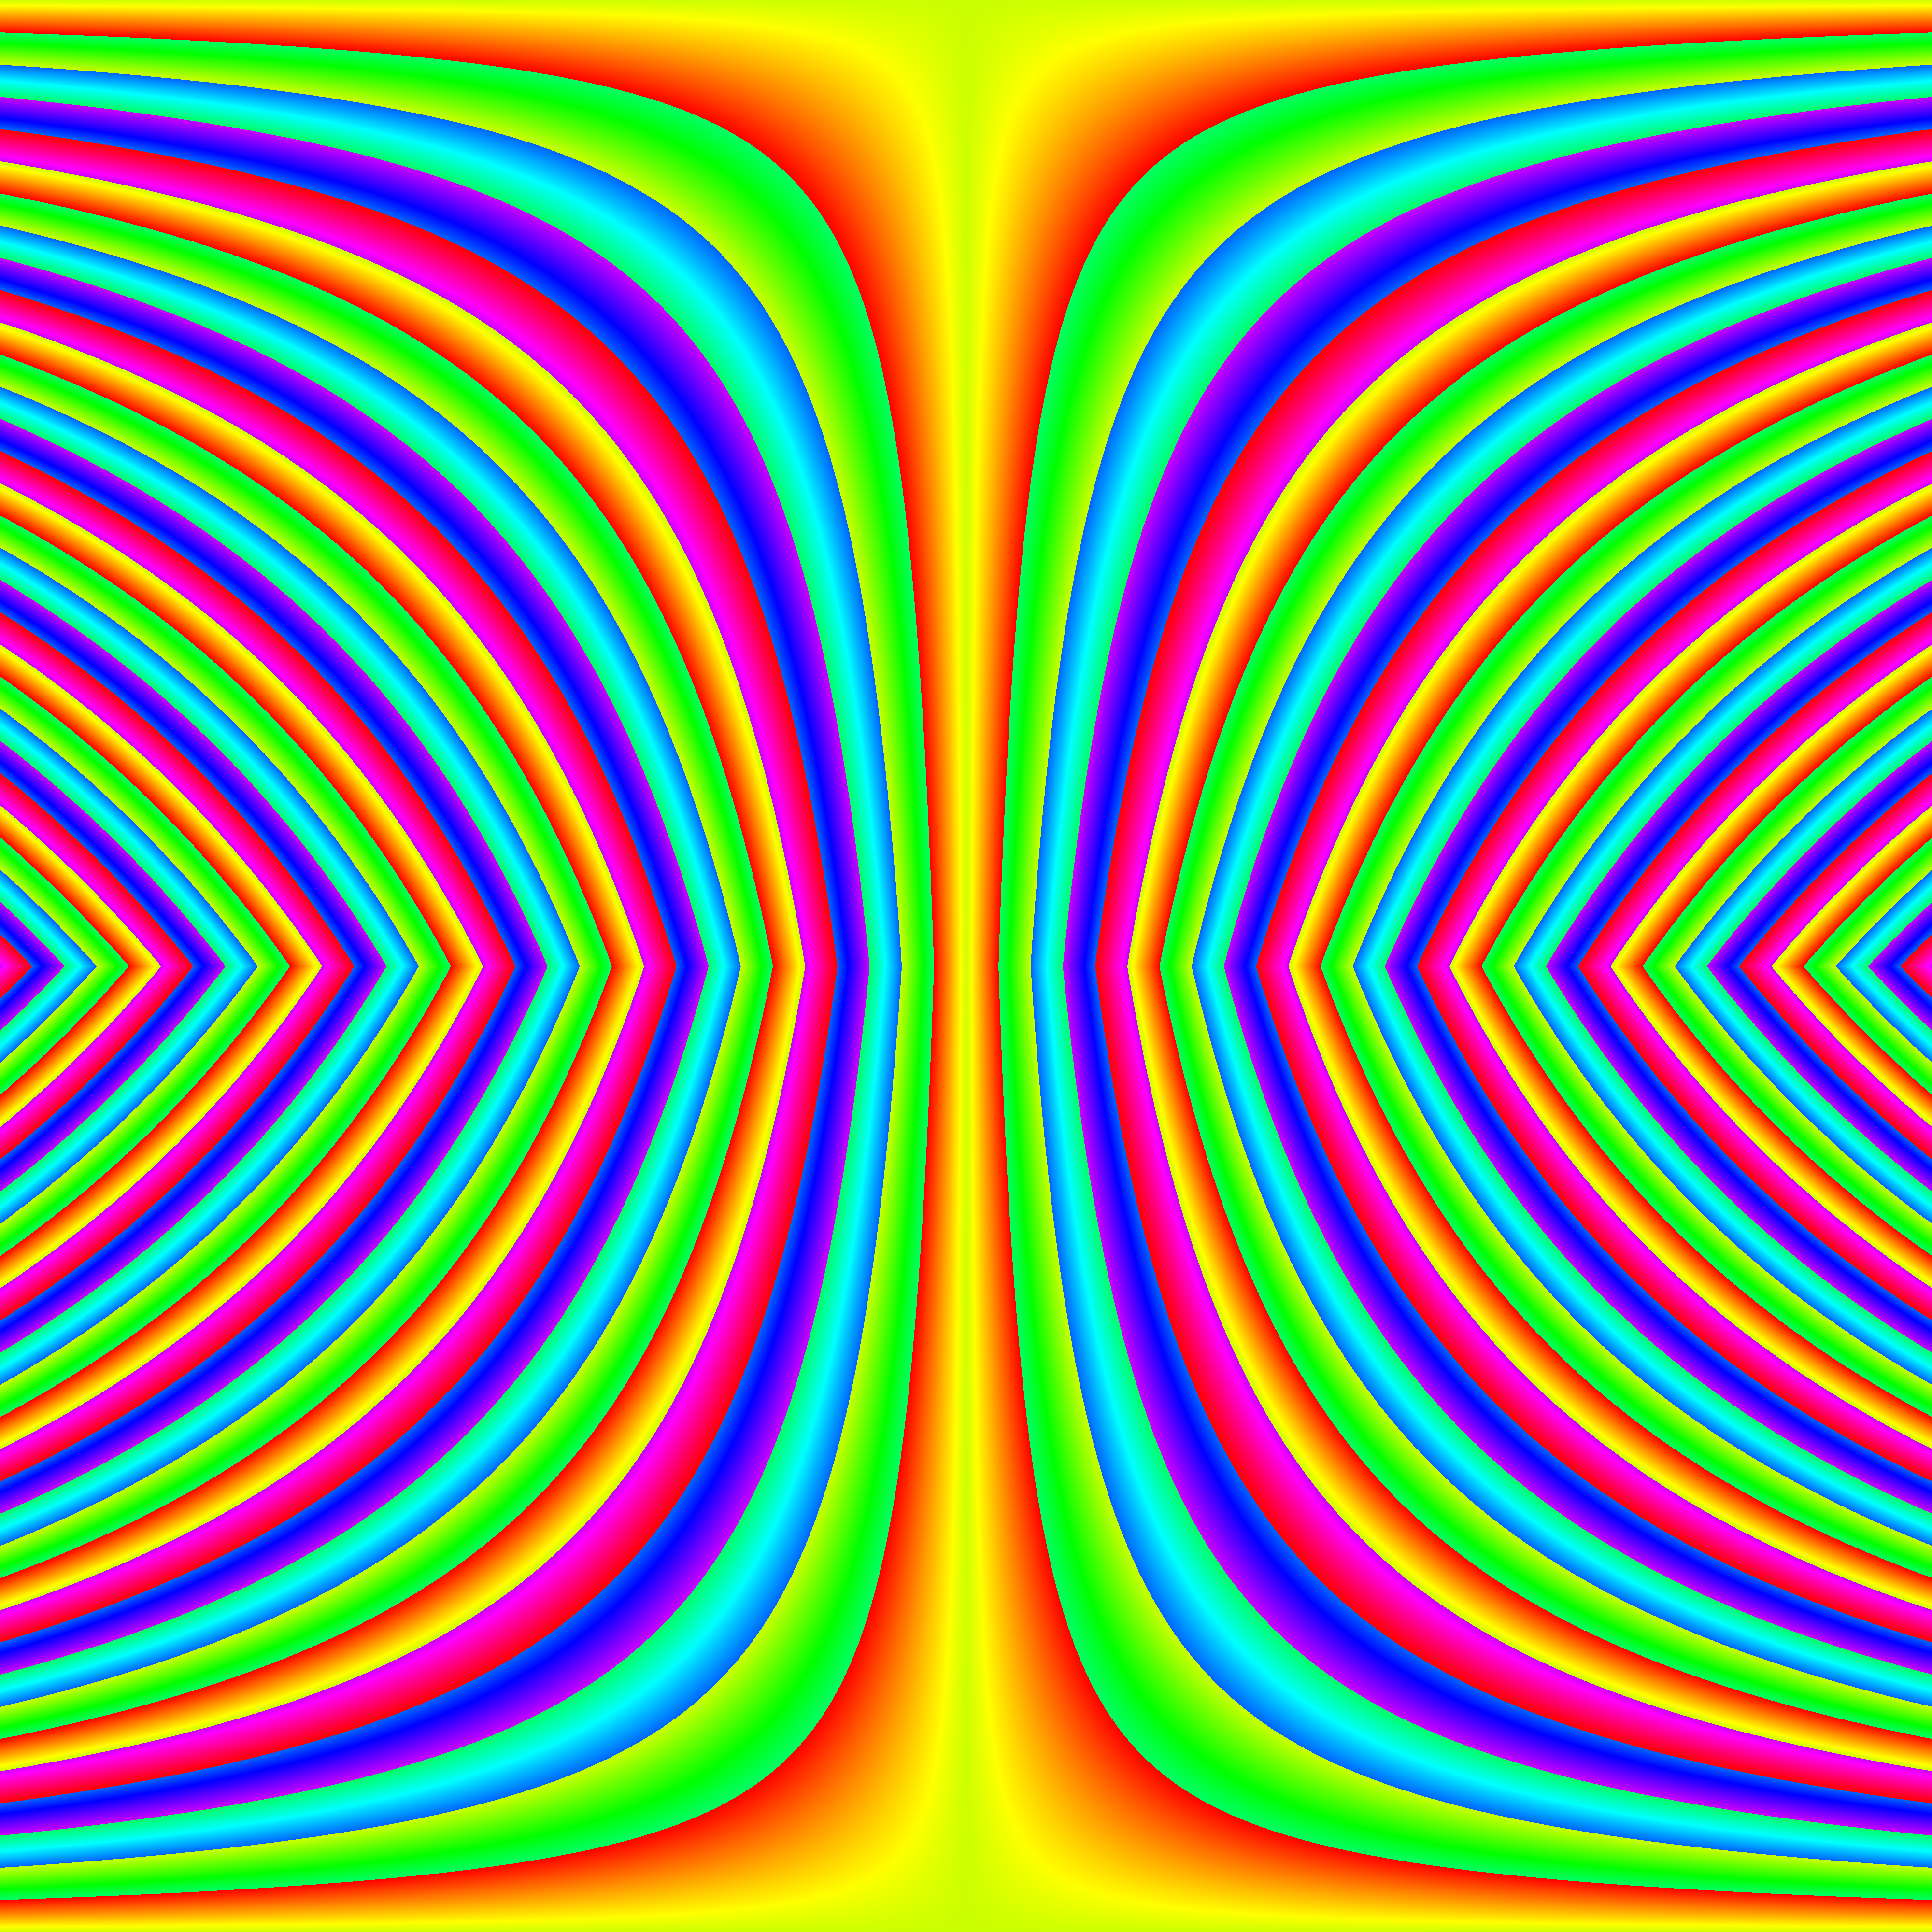
This graphics program uses polar coordinates (yep again!), transparency, circles, trigonometry, lines, triangles and so much more to make some fantastic images. His blog post with more info.

ezgif.com-optimize

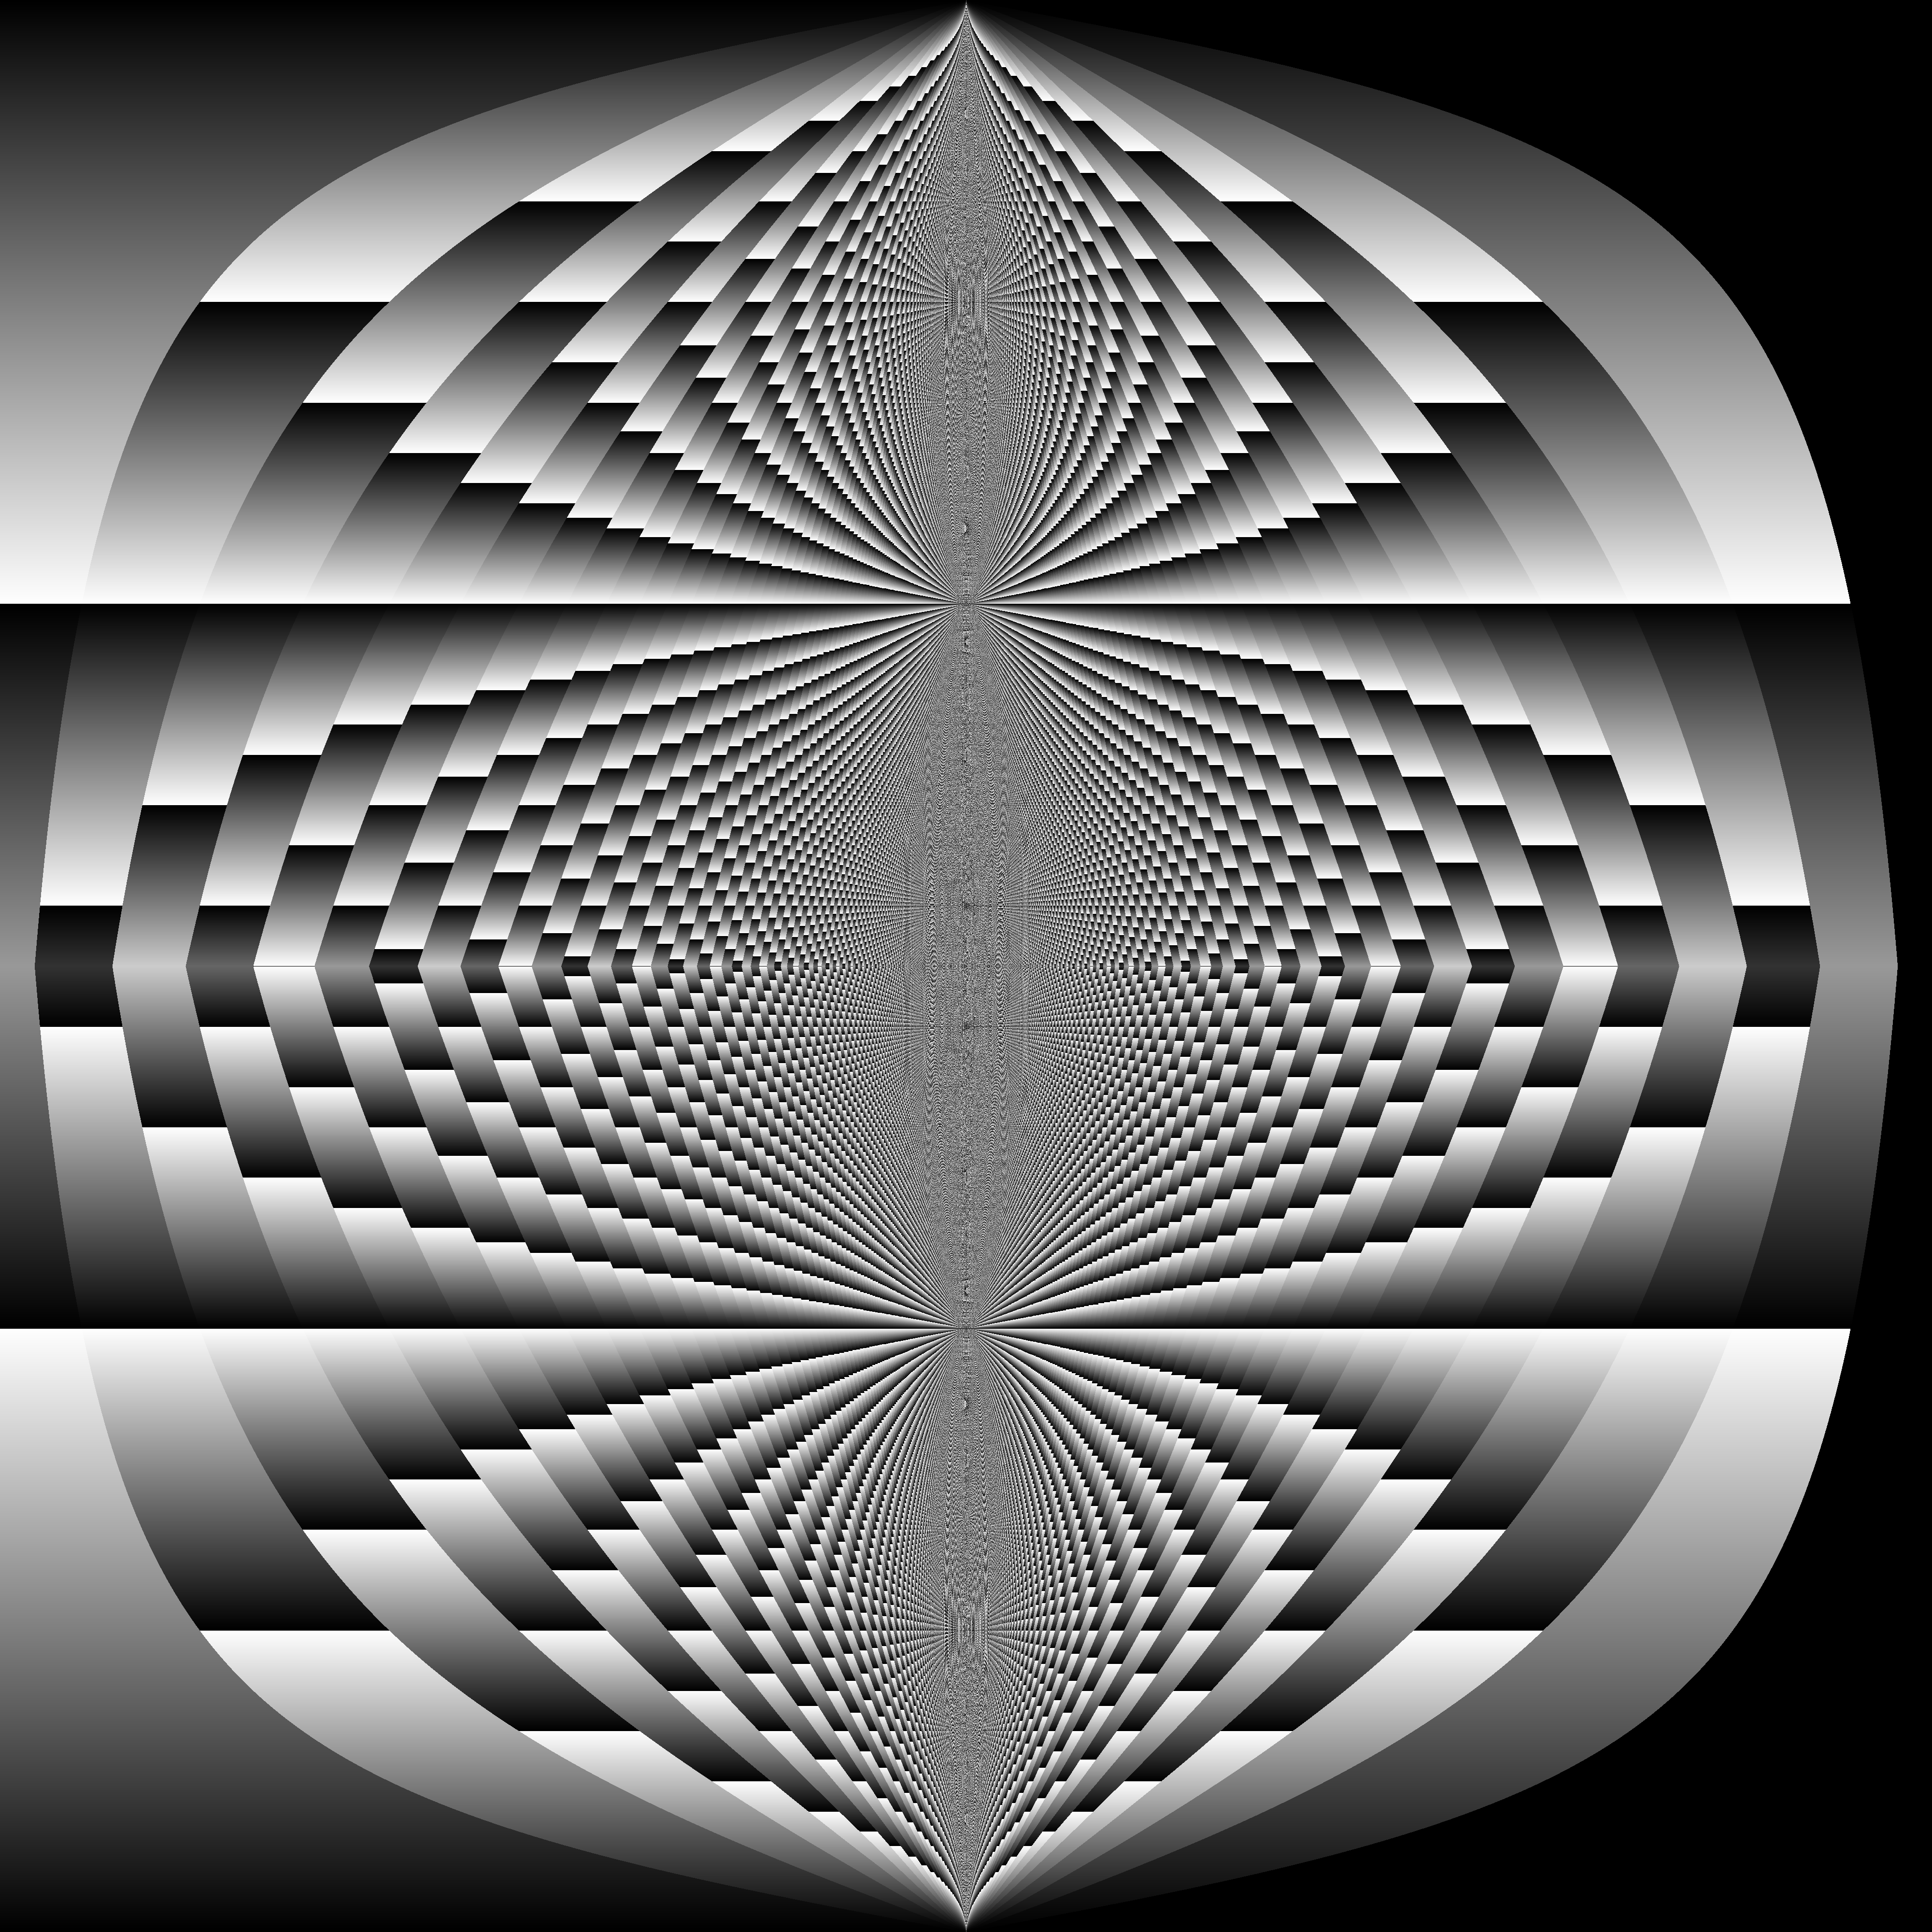
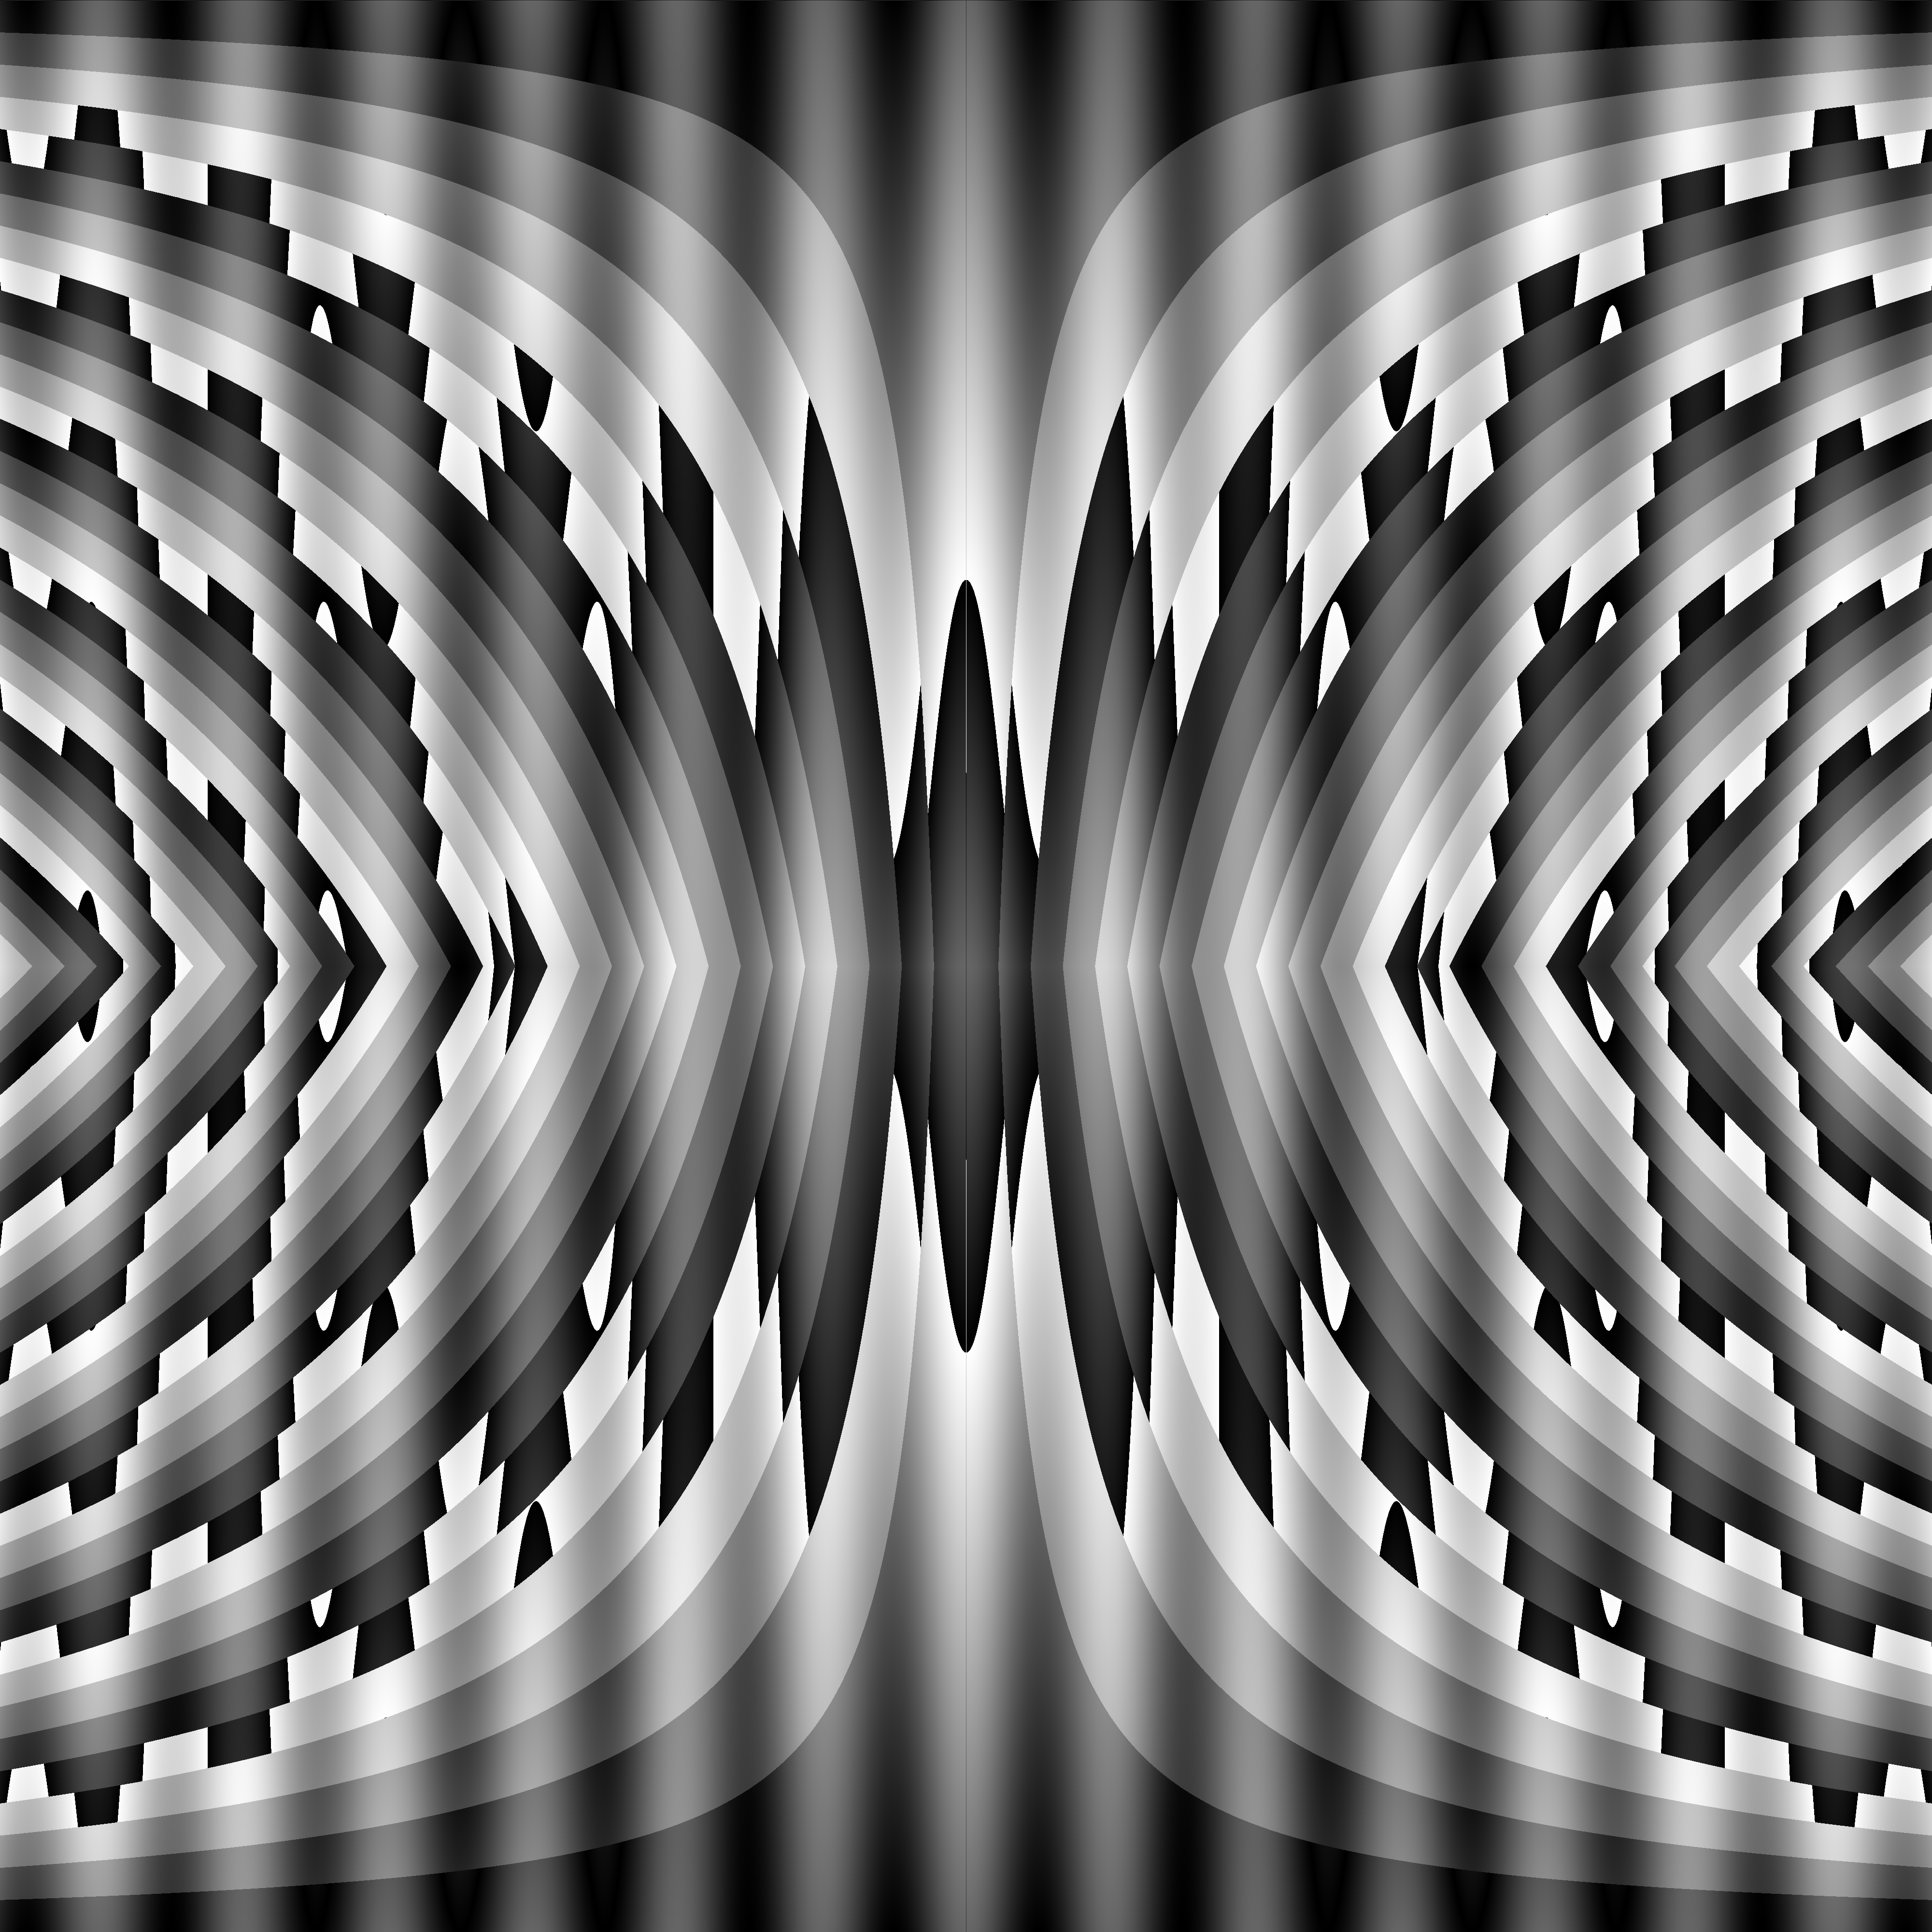
This student did a project that has a grid of rectangles in a 3D environment and he rotates them in 3D based on a periodic pattern and the mouse position. Some really great use of translations, rotations, and 3D geometry. Here’s his blog post.

Capture1-1

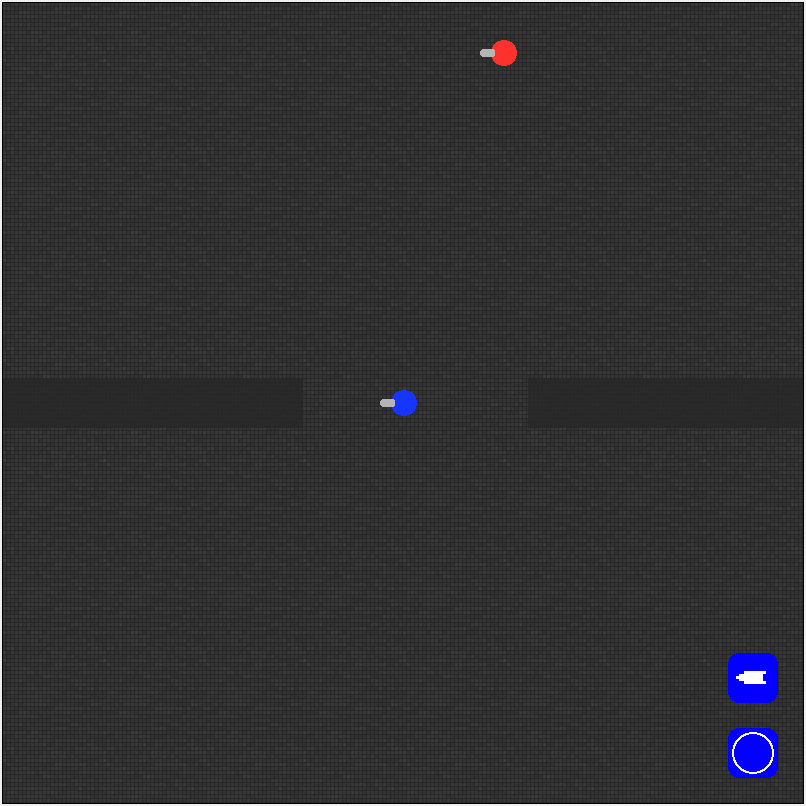
This student made a tank shooter game where the user (blue) battles the AI enemy (red). The really great math that this student had to apply and learn was the use of arctan to get an angle between two coordinates so that he could shoot between the coordinates. Impressive math. Blog post (sadly without the code or a link!).

ezgif.com-resize

Lastly, here’s a student’s work on making a bunch of bouncing coins. The math that this student had to work through was using vectors to make a gravity system and to obey Newton’s first law of motion. This senior hadn’t taken any math class that had vectors, nor had he taken any physics class. Yet he mastered the idea of velocity vectors to get the motion to work properly. He also was somewhat successful in making a collision system (from scratch!), a very hard task. His blog post.

Conclusion

I don’t know. That feels like much of my progress into adulthood. I’m less definitive about statements. I know that I don’t know a whole lot.


Posted in Full Posts | 7 Comments

What to do post AP/IB exam?

With the IB exams coming up soon, I’ve started to put more thought into what we should do after the exams (we’ll have 8 blocks or so). For the past three years we did free-form math projects and last year they even wrote up great blog posts about their projects. But due to less time left (we used to have about 12 classes) and the fact that this class just finished a ~10 page math exploration for the IB exam, I don’t think it’d be as successful. So I’ve had thoughts about having them explore some sort of math-coding thing, very few have taken a programming class in HS due to over scheduling, but are interested in it, and those who have would certainly not be bored. Or we could work on one low floor, high ceiling problem per day for the rest of the year (something like the three triangles problem). Or mix both these and do a bit of both.
I’ll certainly poll the students and see where their interests lie, but I’d like to see what you think. What do you do after the AP/IB exams? What do you think of the programming and/or problem solving sessions?
Thank you for your input.

Posted in interesting stuff | Leave a comment

The Mango Gates – Puzzler

From Car Talk:

RAY: This Puzzler came from Kevin Tobin. A maharajah owned a mango tree that had very sweet, abundant fruit. People would come from miles around to pick the fruit. So the maharajah decided to protect the tree by erecting a series of seven concentric fences around it. Each fence had a gate with a guard. To get to the tree a person would have had to pass through seven gates and pass seven guards. One day, a man approached the guard at the first gate and said, “If you let me pass, when I come back I’ll bring you some mangoes. I will give you half of the mangoes I have, but you must give me one back.” For example, if he brings back 10 mangoes, he’ll give five to the guard and the guard will give one back. The guard let the man in through the gate, and the man proceeded to make the same deal with the other six guards. The question is: How many mangoes did the man have to get to pass back through the seven gates, giving half to each guard and the guard giving one back?

Similar to Gone Fishin’ puzzler.

Posted in interesting stuff | Tagged , | 2 Comments

3d Representation of Dog Chase

Not what it sounds like.
The four dog problem from Steve Strogatz:


Here is how it was used in my class.

Halfway Dogs

If the dogs blindly travel half way towards the next dog before re-aiming, then you get this picture, where each vertex represents the dog’s position:
2015-11-13_14h30_36
If you raise each square up in the z-dimension and print the resulting 3d shape then you can get this:
FullSizeRender

12% Dogs

If the dogs travel 12% of the way before re-aiming then you get this picture, and this 3d shape:

2015-11-13_14h30_20

IMG_2116

Interactive 2d Version

The generalized interactive 2d version of this concept is a lot of fun to play with. In this demo, your mouse horizontal controls how much to spin each square, and your mouse vertical controls how much to scale each square. Matt Enlow was the driving force behind this super fun demo. Some samples:

2015-11-13_14h49_43 2015-11-13_14h50_01 2015-11-13_14h52_05

Code

Here’s the code for both of these shapes in madeup:

Halfway dogs:

thickness = 3
size = 10.0
theta = 0
z = 0
repeat 15
  t = 0
  while t <= 360
    x = size * cos (t + theta)
    y = size * sin (t + theta)
    t = t + 90
    moveto x,y,z
  end
  extrude 0,0,1,thickness
  theta = theta + 45
  thickness = thickness * (0.5)^0.5
  z = z + thickness
  size = size * (0.5)^0.5
end

12% dogs:

thickness = 1
size = 10.0
theta = 0
z = 0
repeat 35
  t = 0
  while t <= 360
    x = size * cos (t + theta)
    y = size * sin (t + theta)
    t = t + 90
    moveto x,y,z
  end
  extrude 0,0,1,thickness
  theta = theta + 8.775
  thickness = thickness * 0.84
  z = z + thickness
  size = size * 0.8775
end
Posted in Full Posts | Leave a comment

Linear Functions, Cardiods, and the Mandelbrot Set

This tweet was retweeted by Steve Strogatz:


What a great video, linking linear functions, cardiods, and the family of Mandelbrot sets. Rang my bell.

Here’s some of my previous lessons and experiments that involved these things:

  • The Mandelbrot Set viewed through Pre-Calculus. Presentation, Lesson Plans, and Interactives. Links to the various blog posts are at the bottom of the page.
  • Processing Experiments:
    • Waning Moon – Steps through linear functions with slope 1 to 4.
      2015-11-09_08h31_23
    • Interactive Waning Moon – Uses the mouse to control the slope and the y-intercept of the linear function.
      2015-11-09_08h29_26
    • Linear Waning Moon – Interactive. Same process, but instead of a circle, inputs are in a line at the top and outputs are in a line at the bottom.
      2015-11-09_08h29_54
    • Linear Mod Art – Interactive, similar setup as above, but useful for teaching how it works.
      2015-11-09_08h30_52
    • Sine Mod Art – Same as above, but using a sine function instead of a linear function.
      2015-11-09_08h32_37
    • Waning Sine Moon – Interactive circular version using sine.
      2015-11-09_08h33_58
    • Waning Exponential Moon – Interactive circular version using an exponential function.
      2015-11-09_08h35_05

The nice thing about the processing versions is you can pretty easily create large image files that you can print:
IMG_2083
IMG_2084


Posted in interesting stuff | Tagged , , | Leave a comment

The Last Seat : Car Talk Puzzler

Yet another great car talk puzzler, The Last Seat:

RAY: You’re one of a hundred people standing in line to get onto an airplane that has 100 seats. There’s a seat for every person who’s in line, and each of you has a boarding pass for your assigned a seat. The first person to walk onto the plane drops his boarding pass and, instead of picking it up, decides, “I’m just going to sit anyplace.” He takes a seat at random.

Now, every other passenger will take either his assigned seat or, if that seat is taken, that passenger will take any seat at random.

TOM: I’ve been on that flight!

RAY: You are the last passenger to walk onto the plane. Obviously, there’s going to be one seat left, because everyone else is sitting in his correct seat, or not.

The question is: What are the chances that you get to sit in your assigned seat? I’m going make this multiple choice.

A: 1 out of 2.
B: 1 out of 10.
C: 2 out of 50.
D: 1 out of 100
E: Zero.

What strategies could you give students to help them reason their way through this puzzle?

Posted in Full Posts | Tagged , , | 5 Comments

Visualization of a Function Through Time

(This post demonstrates the math behind the creation of some unusual math art. I got the idea from this tumblr post which I don’t even think works like this. But it was the inspiration behind the pictures.)

Take this function: f(x) = x^2 + a*cos(ax). When you take values of a between 0 and 8 and back to 0, you get the following:

gifsmos

I’d like to make an image that represents the entire family of this function. Problem one: the function values get pretty large in this window, so find the remainder of the function output after dividing by 5. Here’s the gif of that output:

gifsmos (1)

Problem two: How do we represent this in one static picture? If you take the first image (where a = 0)

2015-10-15_10h49_09

and take the function values from 0 to 5 and make the pixels for row 1 colored based on the function value (0 being black, and 5 being white), then you get this row of pixels (expanded to 20 pixels high for ease of viewing):

blahfirstline

So this row of pixels represents a = 0. If you set a to be 0 at the top of the picture, a to be 8 at the middle of the picture, and a to be back to 0 at the bottom of the picture, stitch all these lines together you get:

smaller
Click on image for full 4k by 4k resolution.

Here’s another with the function y=(10a)/(1+x^2) with a going from 8 to 0 to 8.

type2s
Click on image for full 4k by 4k resolution.

Here’s another with the function y=ceil(ax) – ax + floor(ax) with a going from 0 to 5 to 0.

type3s
Click on image for full 4k by 4k resolution.

And lastly, here’s the last one, but colorized. The 0 to 255 now controls the hue of the color (with full saturation and balance, using HSB color).
type3cs
Click on image for full 4k by 4k resolution.

Here’s the code for those who are interested (or view it live on openprocessing)!

int max_a;

float mod(float a, float b)
{
  //desmos mod and processing mod act differently.
  //desmos mod always returns a positive value
  return (abs(a % b));
}

float func(float x, float a)
{
  //type 1
  max_a = 8;
  return (mod(x*x - a * cos(a*x),5));
  
  //type 2 this counts from a= 8 to 0 to 8
  //max_a = 8;
  //a = max_a - a;
  //return (mod((10*a)/(1+x*x) ,5));
  
  //type 3
  //max_a = 5;
  //return(mod(ceil(a*x)-a*x+floor(a*x) ,5));
}


void setup()
{
  size(1000,1000);
  colorMode(HSB,255);
  int w,h;
  float x,a,f,hue;
  max_a = 5;
  loadPixels();
  for (int i = 0; i < pixels.length; i++)
  {
    w = i % width;
    h = int(i / width);
    
    x = map(w,0,width,-6,6);
    
    if (h < height/2)
    {
      a = map(h,0,height/2,0,max_a);
    }
    else
    {
      a = map(h,height/2,height,max_a,0);
    }

    f = func(x,a);
    hue = map(f,0,5,0,255);
    
    pixels[i] = color(hue,255,255);
  }
  updatePixels();
  //save("type3c.png");
}

edit 10/16/15:
Here are a couple more pictures for you (the code on openprocessing is up to date with these new types):
type5s

type4s

Posted in Full Posts | Tagged , | 3 Comments