
The madeup language for creating 3d models came out a week ago for the kickstarter backers. There is more information about the computer programming language found at the kickstarter page. It’s been a lot of fun to play with but looking at it through the lens of being able to create calculus 3d solids has been really exciting.
Rotational Volumes
Here is the code to sketch out this 2d shape on the x-y plane and rotate it around the x-axis:
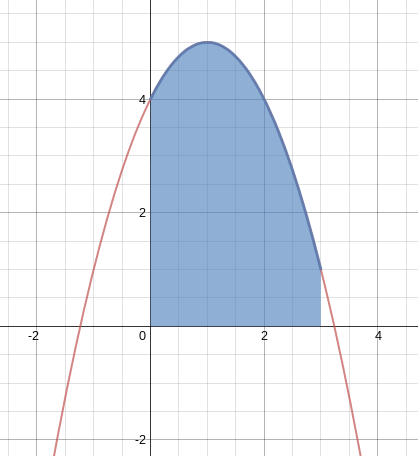
to func x
out = -1 * (x - 1)^2 + 5
out
end
moveto 0,0,0
x = 0
xmax = 3.0
numPoints = 100
while (x < xmax)
out = func(x)
moveto x,out,0
x = x + xmax//numPoints
end
moveto xmax,0,0
moveto 0,0,0
nsides = 100
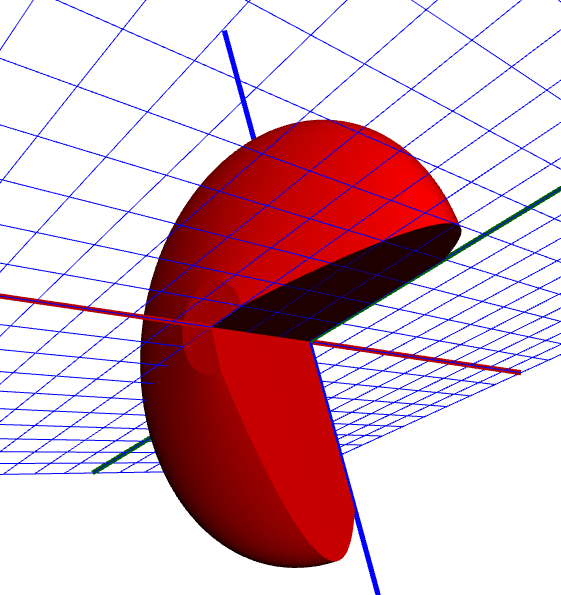
revolve 1,0,0,270
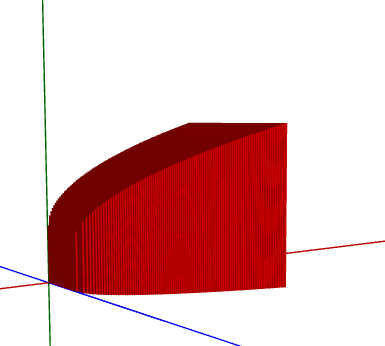
When you click the solidify you get this 3d shape (only rotated 3/4 of the way around for sake of visulization):
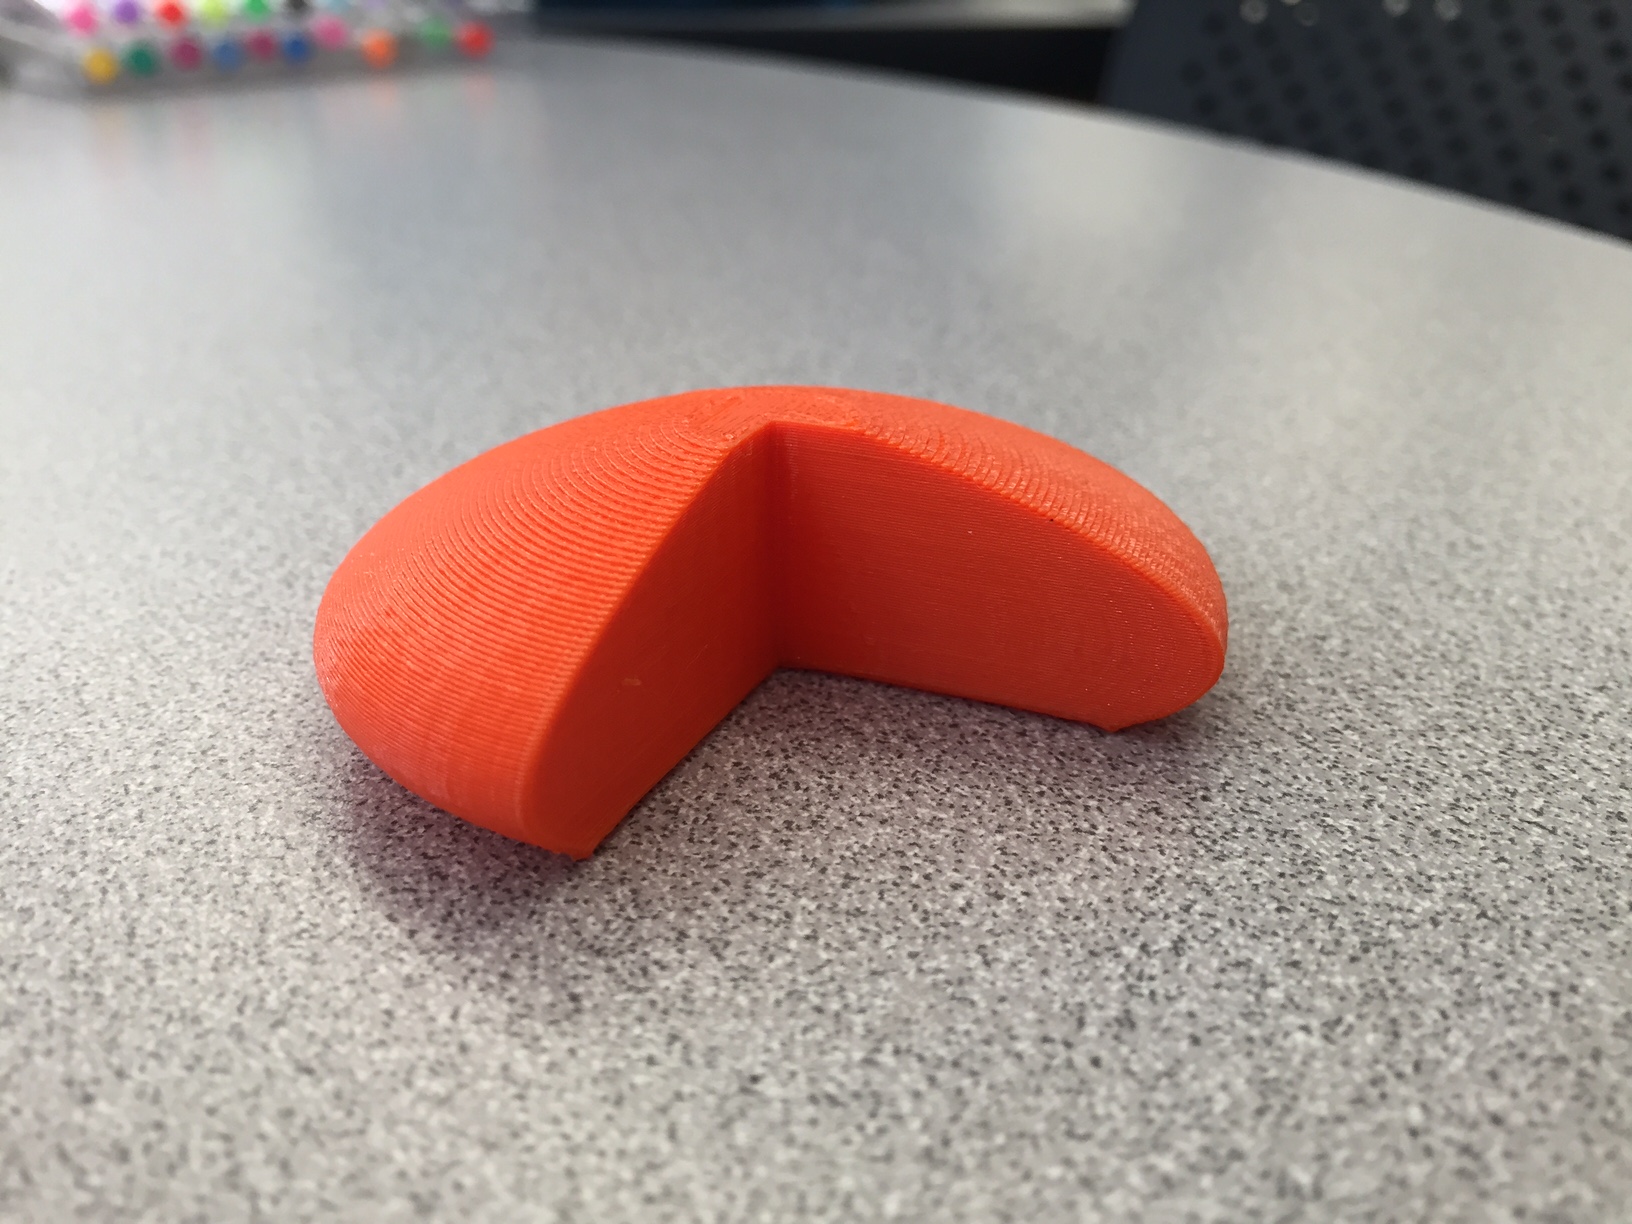
Here’s the magic step. Click Download and open the .obj file with your 3d printer software and hit print:
Want to rotate around the y-axis instead and practice shells? No problem.
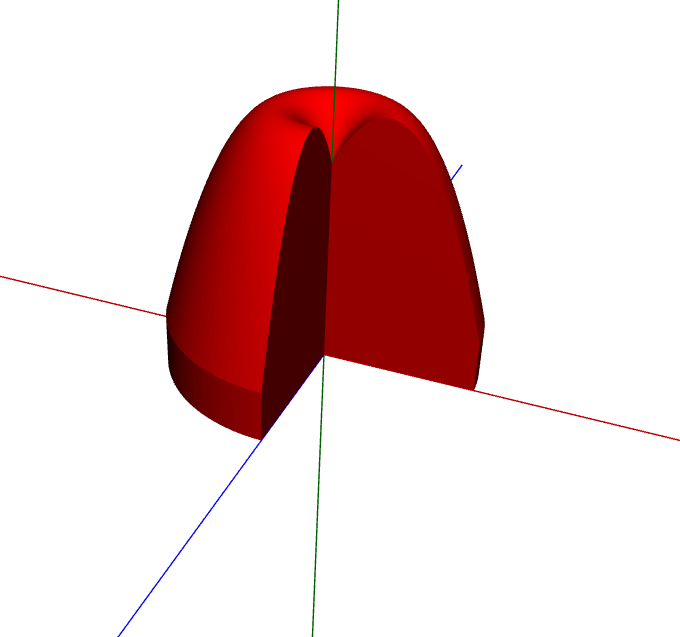
And print!
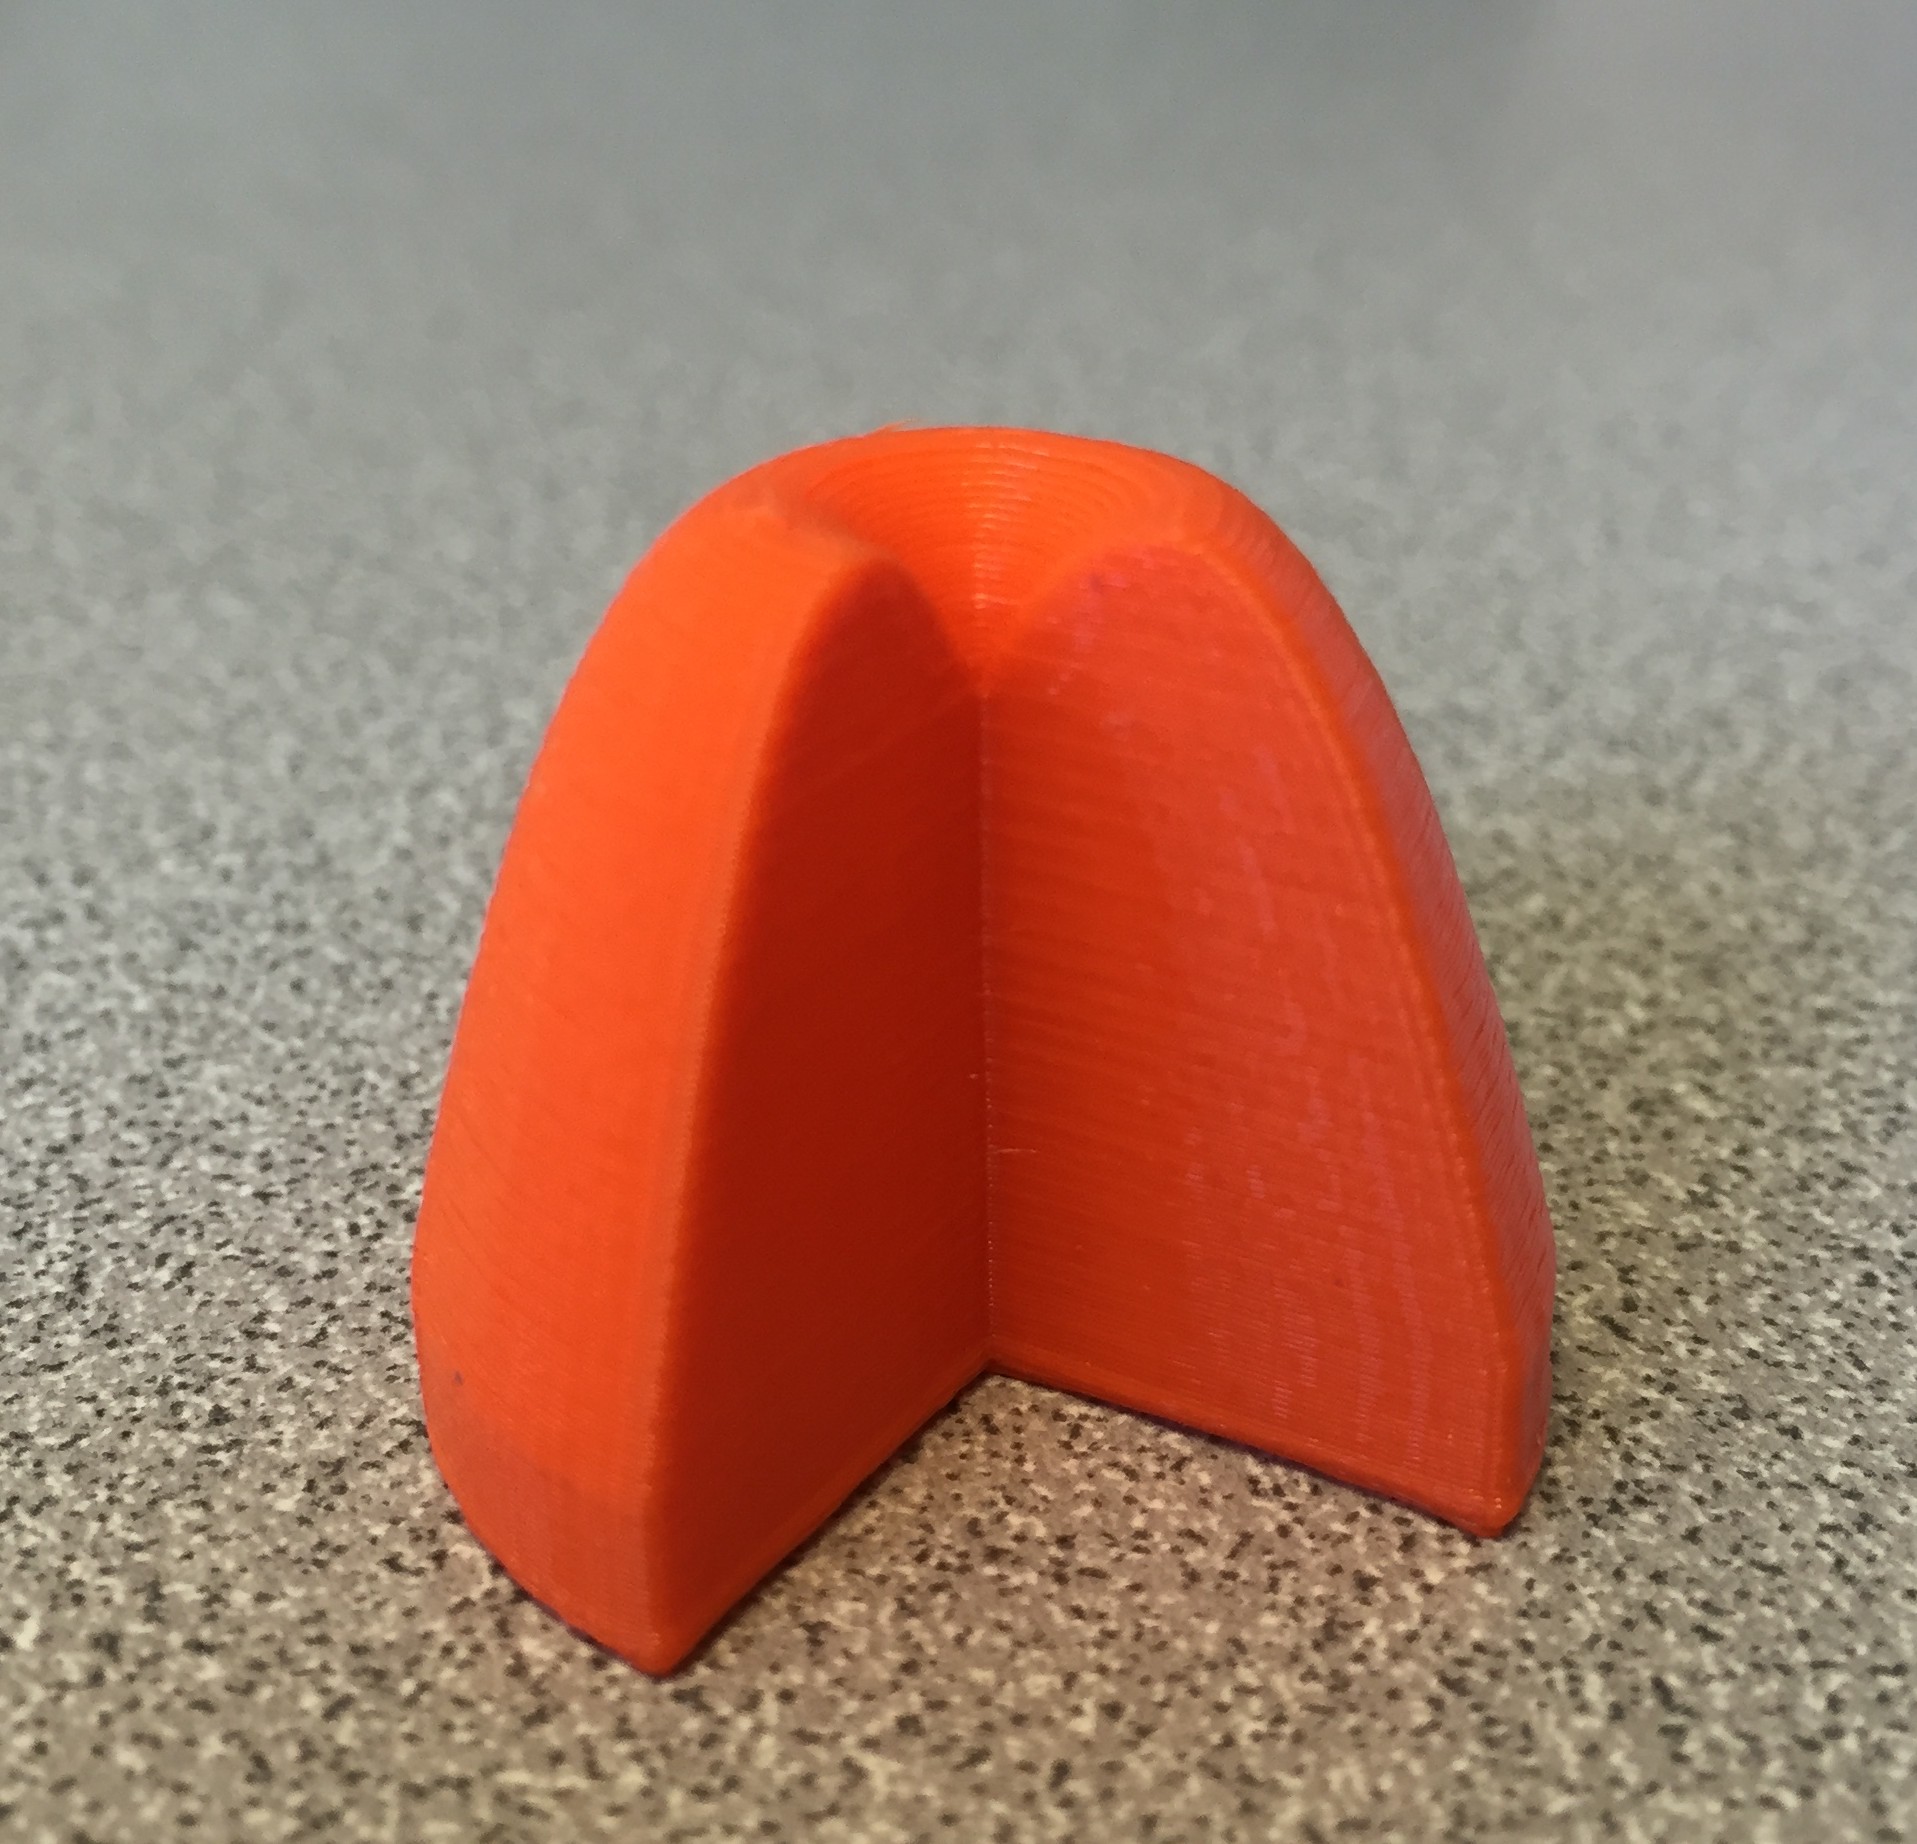
Cross-sectional Volumes
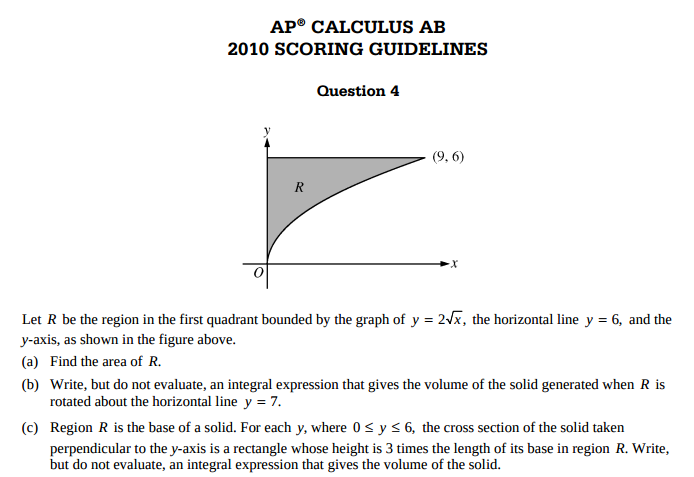
The AP (but not the IB) curriculum has students find the volume of a solid created by extruding out a known cross-section from a given area. For instance, on the 2010 AP Calculus AB exam, they asked the following question, zone in on part (c):
This type of question is difficult for students to visualize. Madeup can make some great models (that can be printed) for the students. While I think the programming is tricky enough that I wouldn’t encourage you to bring the code directly to novices; it is pretty clean and easy to modify. For example: take the same area as above and find the volume by taking cross sectional squares with one side on the xy plane and perpendicular to the x-axis.
In the madeup world, the code looks like this:
to func x
    out = x ^ 0.5 + 1
    out
end

moveto 0,0,0
x = 0
xmax = 3
numRect = 14

while (x < xmax)
    out = func(x)
    moveto x,out,0
    moveto x + xmax//numRect,out,0
    moveto x + xmax//numRect,0,0
    moveto x,0,0
    x = x + xmax//numRect
    extrude 0,0,1,out
end

moveto xmax,0,0
moveto 0,0,0
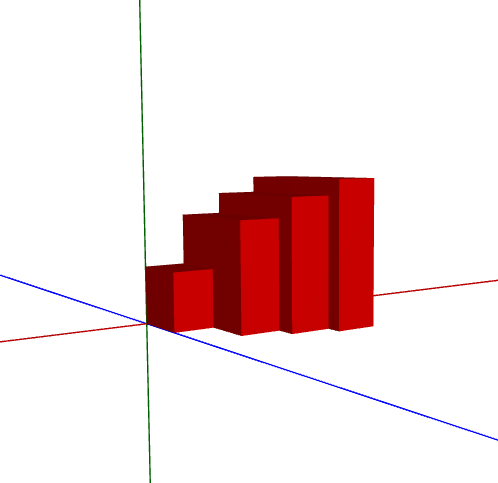
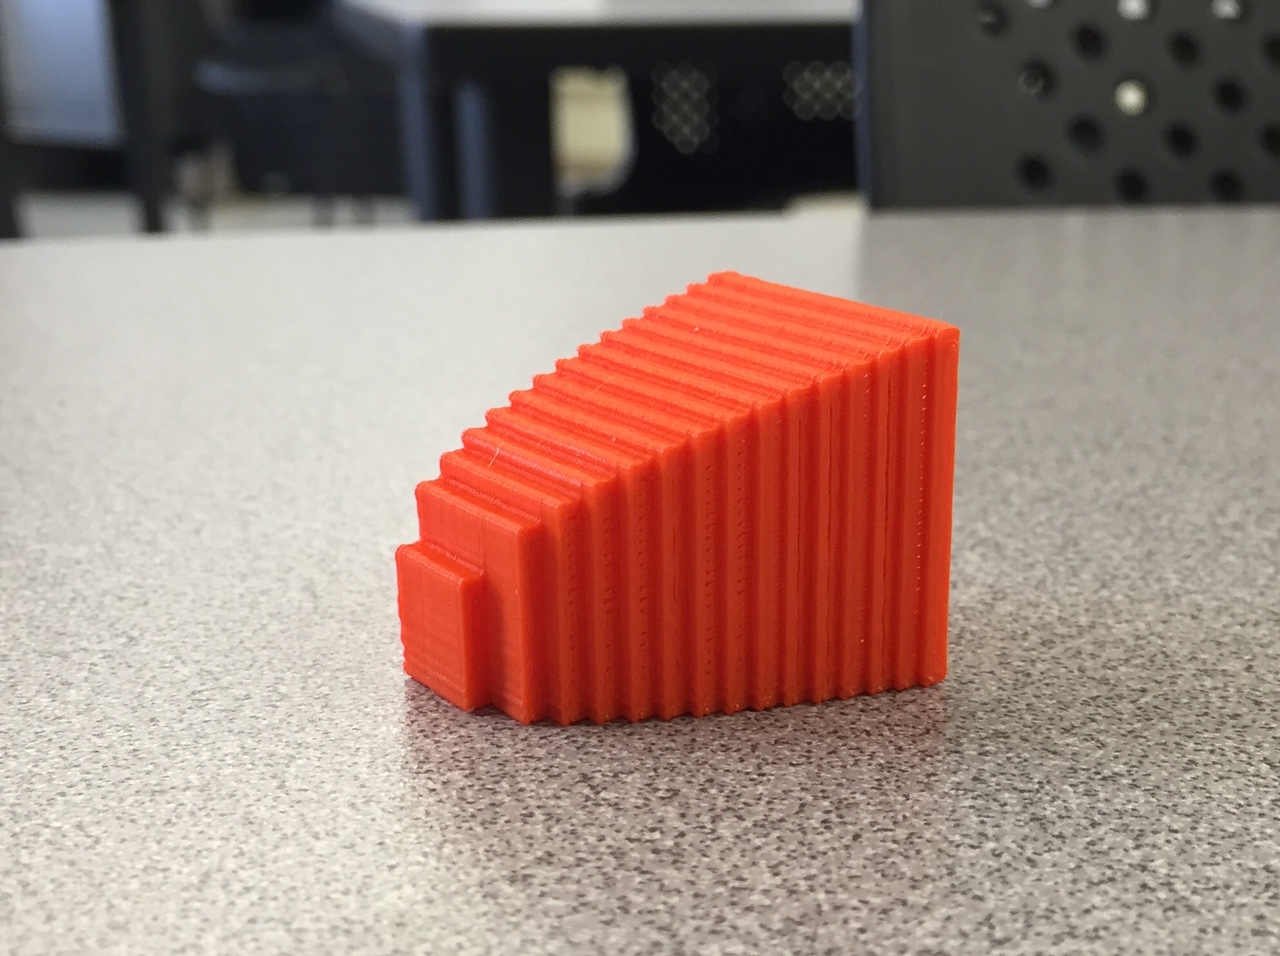
When you hit the extrude button, it takes the 14 rectangle slices and brings it up the z-axis to make a square. The result is the 3d shape:
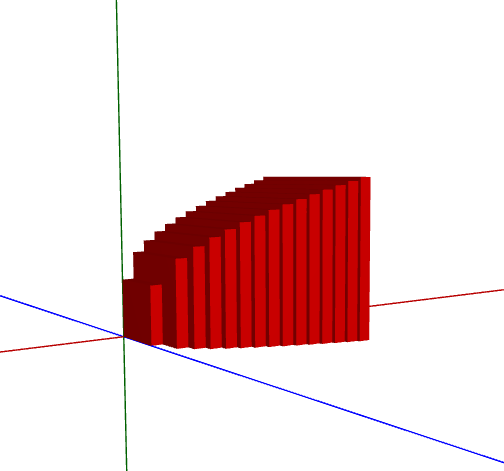
Here’s the shape (approximated) with 4 rectangles:
And here’s the shape with 100 rectangles:
Print!
Enjoy! As always, please fire away with questions/comments/etc.


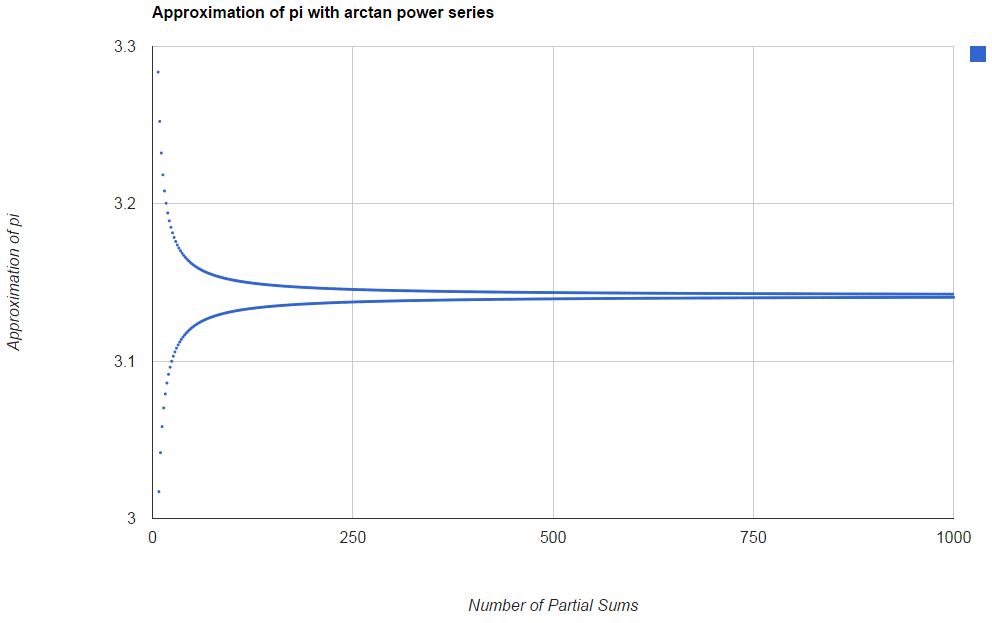
 to the series for
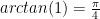 , so
, so  .
.